Tag: Power BI Desktop

  • The new Paginated Report visual is here!
    The new Paginated Report visual is here!

    Last Friday Microsoft put out the Power BI June 2021 Feature Summary which included the much awaited Paginated Report visual. I’ve been waiting for this rather impatiently for the past few months and am thrilled that it is finally here. Read Chris Finlan‘s full post about the Paginated Report visual here: Paginated report visual for Power BI reports is now available in public preview.

    In my working world we utilize Paginated Reports quite heavily and the release of this visual is truly game changing. Now instead of having to move from between Power BI reports to visualize data the way that you want to see it, you are finally able to interact with the data in a single, seamless report. This also opens the Paginated Reporting world to lots of more people who may not have considered this report type until now.

    I sat down to write this blog post and apparently I had quite a bit to say because what was meant to be a simple blog post turned into a 30 page white paper. In the white paper I cover a simple reporting solution that I want to utilized a Paginated Report in, how to use a SharePoint Online list a the tracking mechanism, how to create a simple paginated report, how to publish the report into the Power BI Service, and finally how to utilize the new Paginated Report visual in a Power BI Report canvas. The last one of these is what I am going to focus on in this post.

    If you want to find the full white paper please feel free to click here to access it. To read about is just the new Paginated Report visual, the please continue reading! One thing to keep in mind with this post… it is a excerpt from the white paper, so anything that doesn’t quite make sense probably does in the context of the full white paper. Here goes!

    Using the Paginated Report visual in the Power BI Report

    Setting up Power BI Desktop

    The Paginated Report visual became available in the June 2021 update of Power BI Desktop as a Preview Feature. This means that you must manually enable it once you have updated to the June 2021 version of Power BI Desktop. To do this you go to File | Options and settings | Options.

    Next go to Preview features under GLOBAL and check the box for “Paginated report visual”. We will be required to restart Power BI Desktop once you are done with this step.

    Adding the Paginated Report Visual

    Now that Power BI Desktop is reopened we will find the Paginated Report Visual in the Visualizations pane.

    Once we click the visual icon it will drop into the open space on the canvas, and we can resize it to your desired size.

    Configuring the Paginated Report Visual

    Now we can connect to a report. Click the big yellow button and the screen will change to show us the available Paginated Reports that you can choose from.

    Once we select the Report, we need to add in Parameters before moving forward. Drag the Date & Day Name Fields into the Parameters field in the Visualization pane.

    After we have done that we will want to change the Date from a hierarchy to a single date so that it can be sliced properly.

    Next, we click the “Set Parameters” button and change the parameters from the “use default” option to the specific Power BI fields that we want to use. Once that is done, we click the “See Report” button.

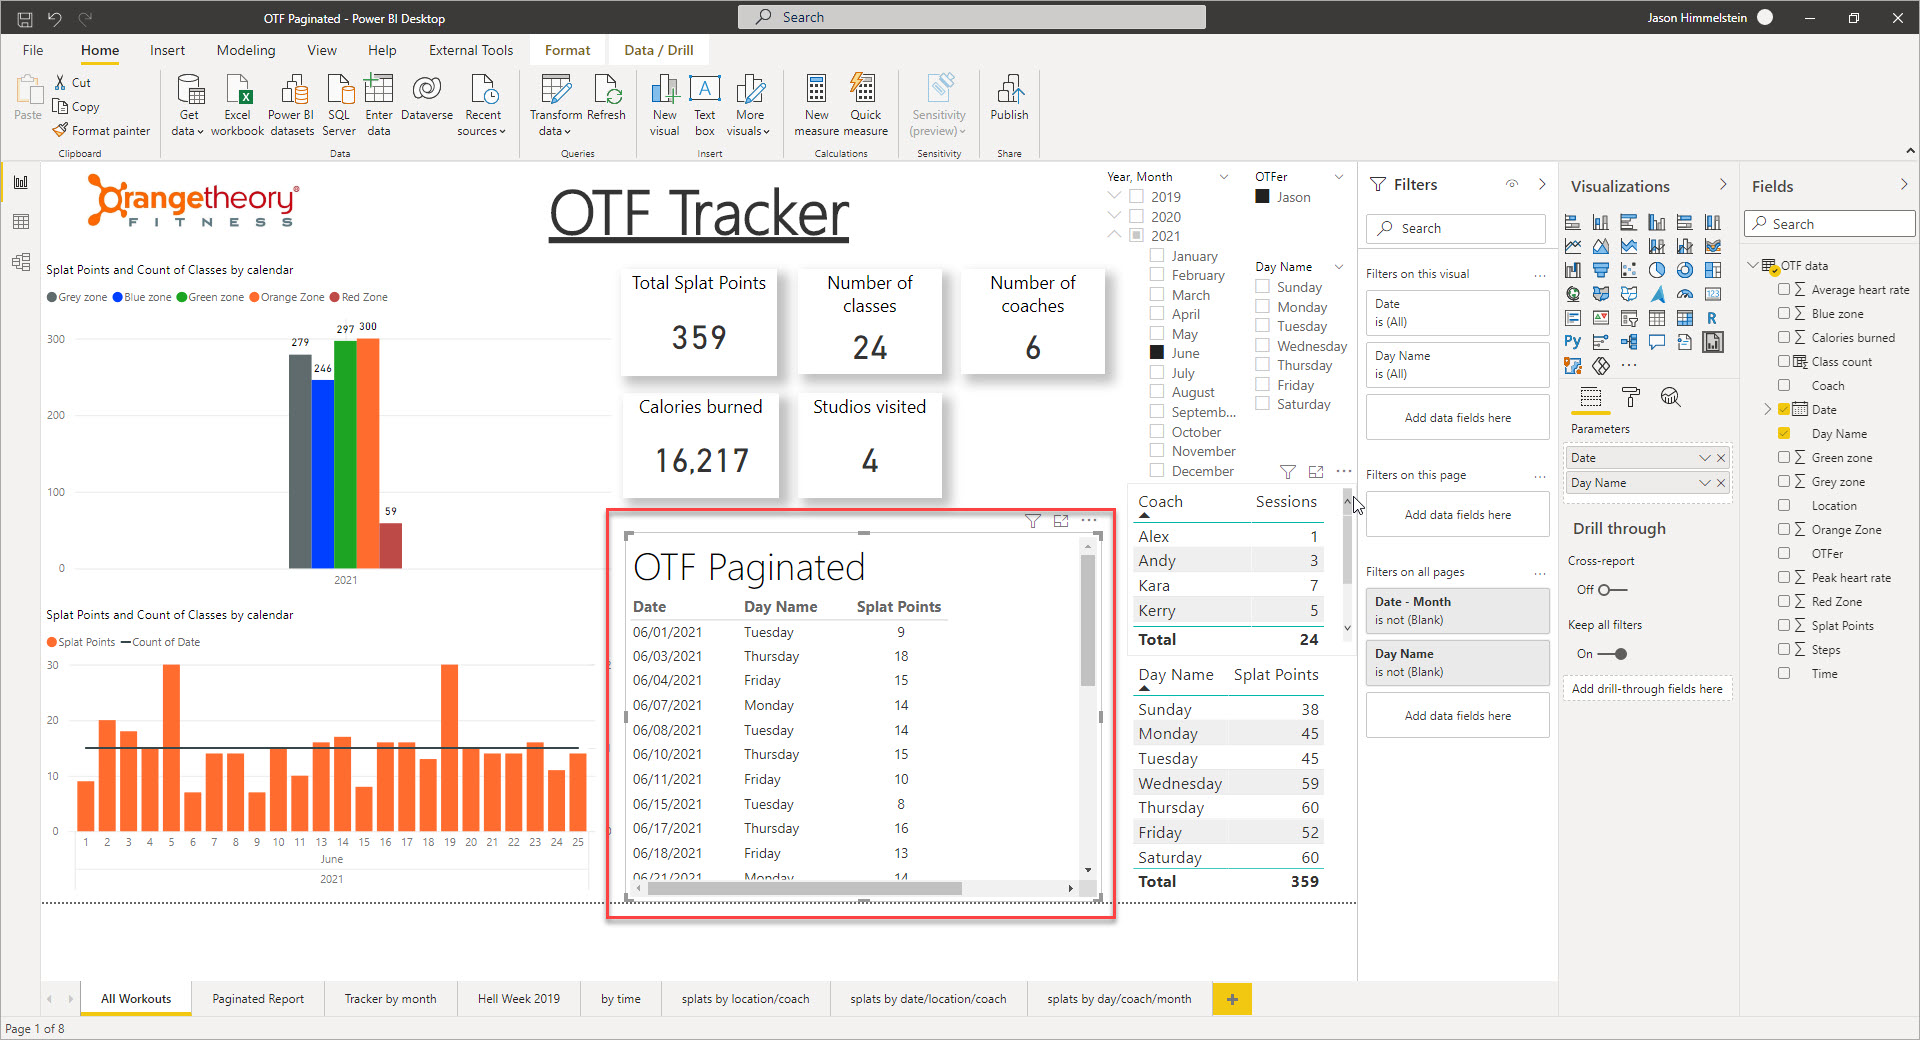
    Once the report renders, we will see the Paginated Report showing up in the visual space we placed it in and filtered to match the rest of the Power BI Report.

    This image has an empty alt attribute; its file name is 41-1024x555.jpg

    Using the Paginated Report Visual

    If we change the month from June to May in the Year,Month slicer we will get a dialog at the top left of the Paginated Report visual that says “Apply Changes” while the rest of the report simply changes. This is the default setting as of the June 2021 release and allows us to not have to wait for the Paginated Report visual to refresh, which takes longer than the other visuals, incase we want to tweak our slicers a few times before seeing the Paginated Results.

    This behavior changed under the Formatting tab of the Visualizations pane when the Paginated Report visual is selected. That can be tricky at times, so I recommend using the Selection pane (found under the View menu in the ribbon) to help us get this visual selected.

    In the formatting options we will find “Auto-apply filters” as a toggle. We will only see “Auto-ap…” as the default layout of the Visualizations pane is small. Once toggled we will see the “Apply changes” box disappear, and it will automatically refresh as we change the slicers.

    While we are making updates in the Visualizations pane, I would encourage you to enable the Toolbar in the visual so that you can do things like change pages and Export data to all of the formats Paginated Reports is able to export to.

    Conclusion

    I hope that you find the Paginated Report visual as amazing as I do. It is going to change the way my customers work with their data.

    If you want to find the full white paper please feel free to click here to access it.

  • Get the Power BI Desktop External tools tab to show up

    Get the Power BI Desktop External tools tab to show up

    The July 2020 release of Power BI Desktop brings some awesome new functionality with it: integration of external tools in the ribbon! There have been external tools written by community member and tools vendors for quite a while now, but they have never integrated with the product and shown up inside of the Power BI Desktop experience until now.

    This is exciting stuff because many of these tools are highly useful today and will continue to grow in importance as the product continues to mature. Microsoft does a great job of advancing its products, far better today than 5 years ago when Power BI first showed up on the scene, but they are never going to be able to do everything. That leaves white space for vendors and community members to contribute.

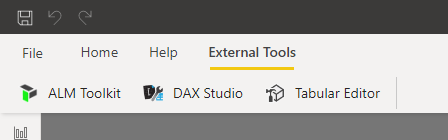
    The first 3 tools that are being made available through the External Tools pane in the ribbon are: ALM Toolkit, DAX Studio, and Tabular Editor. We have been told that Power BI Report Builder will show up in this space eventually as well.

    Here is an excerpt from the blog post on the Power BI blog site explaining a bit more about this:

    The External Tools ribbon contains buttons for external tools installed on the machine and registered with Power BI Desktop. External tools launched from Power BI Desktop are automatically connected to the Analysis Services engine running behind Power BI Desktop providing a seamless experience for users.

    https://powerbi.microsoft.com/en-us/blog/power-bi-desktop-july-2020-feature-summary/#_Launch_external_tools

    As I said, this is great news so why am I bothering to write a post about something that was clearly covered in the Power BI blog and I talked about on the BIFocal.show podcast? The answer is that I updated my work PC to the July 2020 version of Power BI Desktop using the Microsoft Store method and didn’t get the new External Tools ribbon. I was a bit perplexed.

    I checked the Preview features dialog under Options in the Options and settings menu and there was no option for turning it on. I remember that this feature went right to General Availability, so it shouldn’t have shown up there anyway.

    Then it hit me: I didn’t have any of the External Tools installed on my work machine yet. I had them installed on my VM that I use for demos and on my home PC rig, but I haven’t used any of them in my day-to-day for work yet (I’ve only been at EY for 4 months now). These are External Tools meaning they are not a part of the product, so logic says that you have to install them separately to get them to show up and why have a tab if there isn’t anything there to see?

    Once I installed the tools the Tab showed up without an issue, although I had a few hiccups getting them installed. I decided it was probably a good idea to share my experience installing the tools now that a broader group of people are going to be looking at using them.

    Here is my how-to with a few Gotchas along the way. Enjoy!

    The walk-through

    July 2020 Power BI Desktop

    First validate that you are running the July 2020 version of Power BI Desktop. I highly recommend using the Microsoft Store version if you are able to.

    Your next step is to download the tool or tools that you want to use from the list I gave above.

    SmartScreen tries to protect you from yourself… and malicious code

    The first snag that you will likely experience is that the built in Microsoft SmartScreen protection is going to block one or more of the downloads.

    If you chose to go forward, as I did, you need to click on Keep and then go to Downloads.

    Warning! Consult a PC physician if virus symptoms arise. Computers can’t get COVID though…

    You will need to expand the Show more option and choose to Keep anyway so that you can execute the msi package.

    CAVEAT: I am not advocating you install random stuff on your computer. I am showing you what I did, as I personally trust the folks who created these packages. Hopefully they will get signed certificates at some point, 
    but today they are unsigned and that is why this happens.

    Finally you are ready to execute the installer and you get this message:

    Insert corny “you lose” sound effect here… whap whap whappppppp….

    Ok… now you start rethinking what you are doing, not just with this installation but your whole life… maybe I should have been a painter or a chef?

    You finally decide that you really do want to install these super useful tools so you go back to the installer msi and right click then choose to Install as Administrator.

    Then you get this screen:

    I turned around 3 times & spit, splashed holy water, & fed a chicken… do I Run anyway?

    This time you get the option to Run anyway. If you choose to move forward at this point, like I did, you will walk through the normal Install Wizard screens for the software as you would for any other commercial product. Once complete you are ready to go with the tools.

    You will need to restart Power BI Desktop if you happen to still have it open and then…

    Tada!

    You now have the External Tools section of the Ribbon! Congrats.

    If you did everything I listed above you should see this:

    SO PRETTY!

    Your experience may differ from mine, as my own experiences did working across 3 different machines with different levels of access. The scenario I outlined above was in my most restrictive environment and therefore I felt was the most reasonable one to document. There was a step I didn’t document about how I had to elevate permissions differently because of corporate restrictions on my work PC. Every company is going to be different so I left my company specific step out.

    If you have one or some of the External Tools showing up but not all, you may have older versions of the tools installed that need to be updated or you might find that are wondering why don’t have all 3 of the tools showing up you should go watching Adam Saxton‘s Guy in a Cube video explaining that scenario is super useful. If nothing else you should see how he adds in Patrick Leblanc‘s NoSums tool into the Ribbon. That was insane amazing and Patrick is super stoked about it.

    Hope you found this useful. Stay safe & healthy folks!