Category: PowerBI

  • The new Paginated Report visual is here!

    The new Paginated Report visual is here!

    Last Friday Microsoft put out the Power BI June 2021 Feature Summary which included the much awaited Paginated Report visual. I’ve been waiting for this rather impatiently for the past few months and am thrilled that it is finally here. Read Chris Finlan‘s full post about the Paginated Report visual here: Paginated report visual for Power BI reports is now available in public preview.

    In my working world we utilize Paginated Reports quite heavily and the release of this visual is truly game changing. Now instead of having to move from between Power BI reports to visualize data the way that you want to see it, you are finally able to interact with the data in a single, seamless report. This also opens the Paginated Reporting world to lots of more people who may not have considered this report type until now.

    I sat down to write this blog post and apparently I had quite a bit to say because what was meant to be a simple blog post turned into a 30 page white paper. In the white paper I cover a simple reporting solution that I want to utilized a Paginated Report in, how to use a SharePoint Online list a the tracking mechanism, how to create a simple paginated report, how to publish the report into the Power BI Service, and finally how to utilize the new Paginated Report visual in a Power BI Report canvas. The last one of these is what I am going to focus on in this post.

    If you want to find the full white paper please feel free to click here to access it. To read about is just the new Paginated Report visual, the please continue reading! One thing to keep in mind with this post… it is a excerpt from the white paper, so anything that doesn’t quite make sense probably does in the context of the full white paper. Here goes!

    Using the Paginated Report visual in the Power BI Report

    Setting up Power BI Desktop

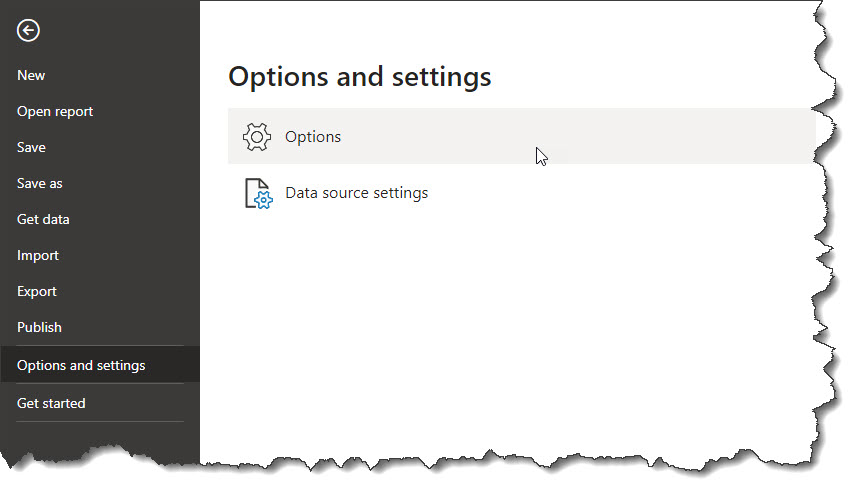
    The Paginated Report visual became available in the June 2021 update of Power BI Desktop as a Preview Feature. This means that you must manually enable it once you have updated to the June 2021 version of Power BI Desktop. To do this you go to File | Options and settings | Options.
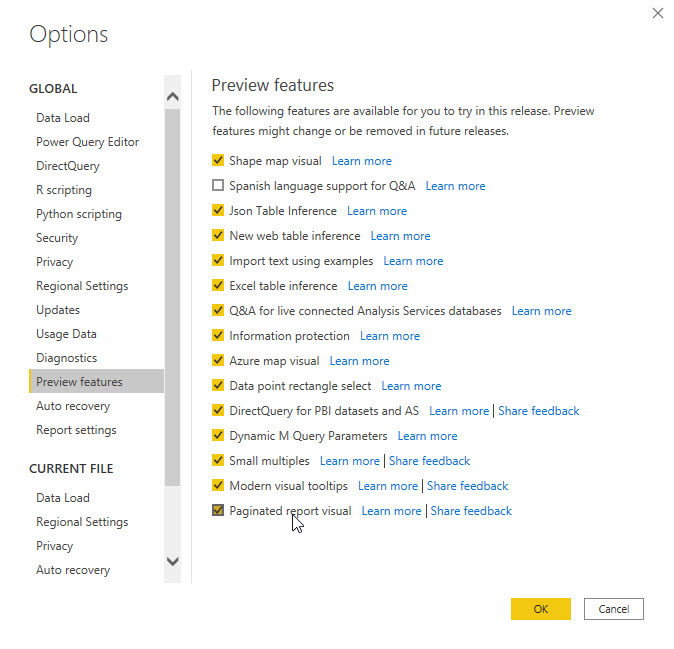
    Next go to Preview features under GLOBAL and check the box for “Paginated report visual”. We will be required to restart Power BI Desktop once you are done with this step.
    Adding the Paginated Report Visual

    Now that Power BI Desktop is reopened we will find the Paginated Report Visual in the Visualizations pane.
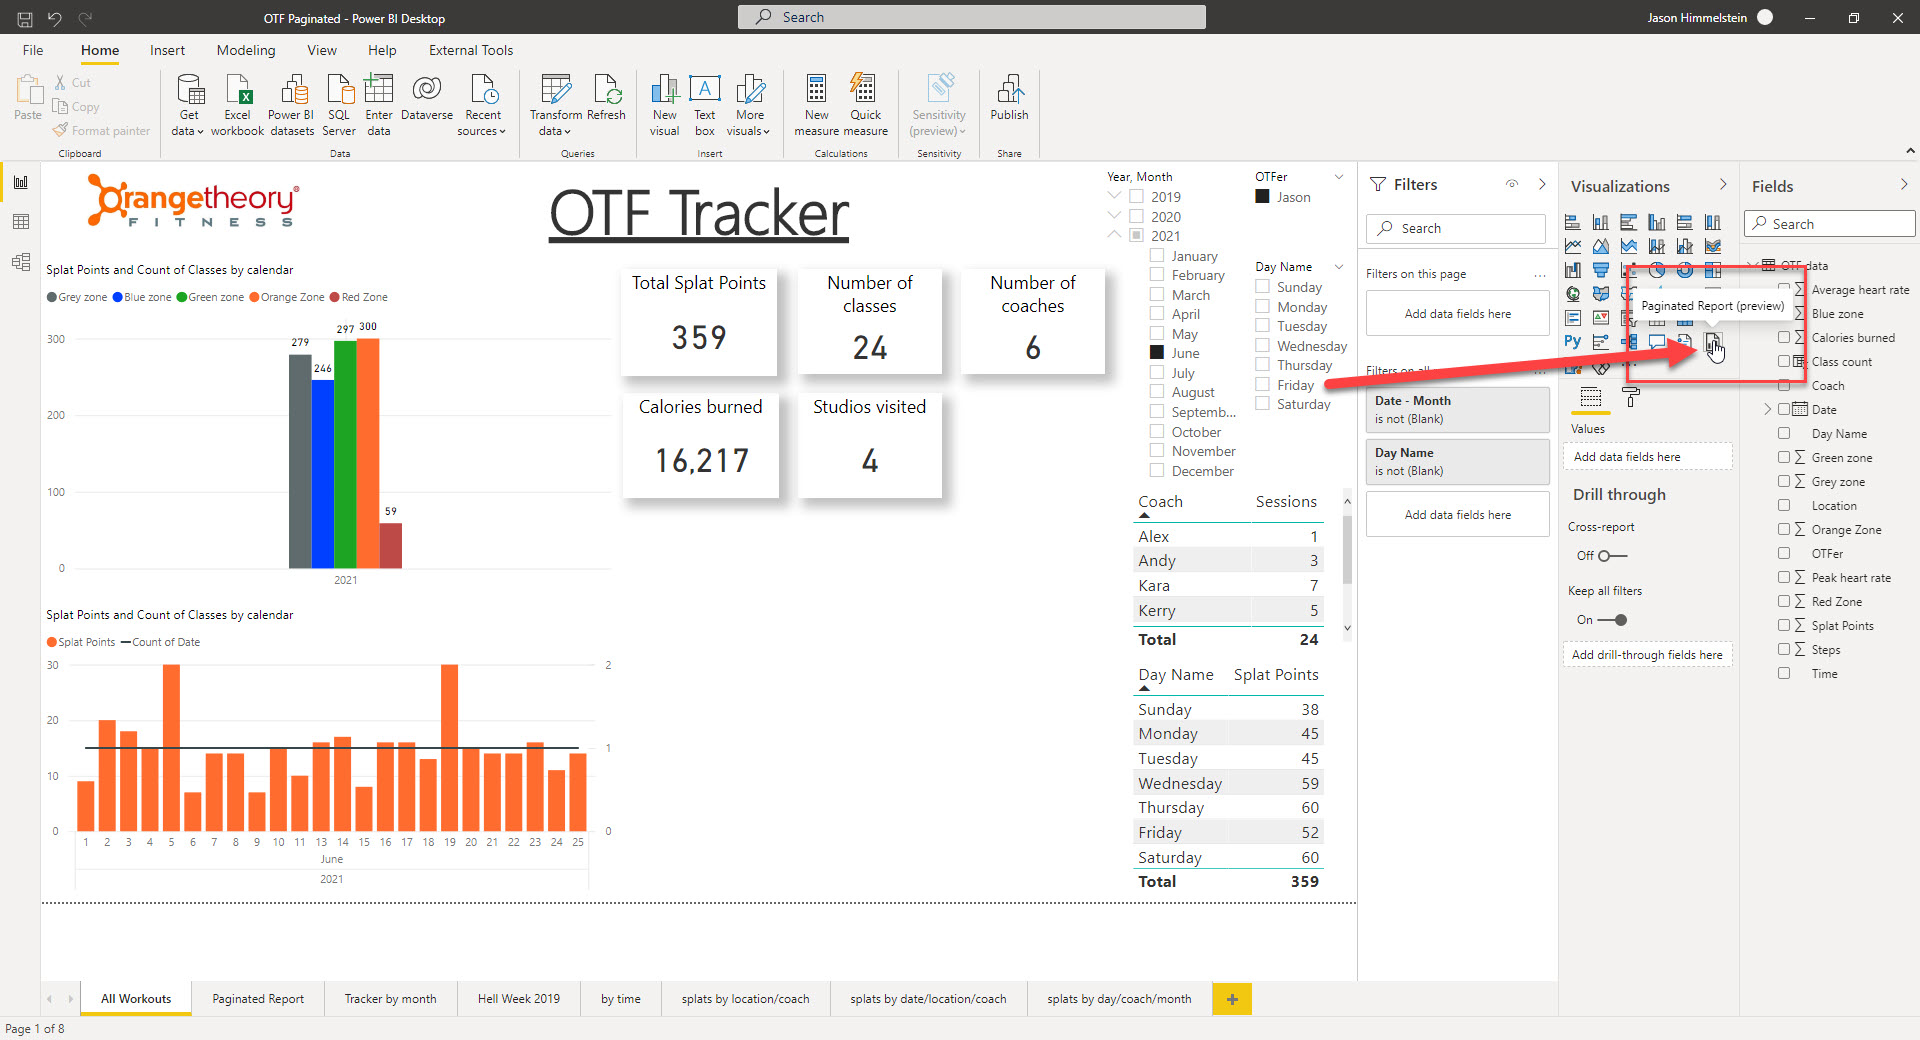
    Once we click the visual icon it will drop into the open space on the canvas, and we can resize it to your desired size.
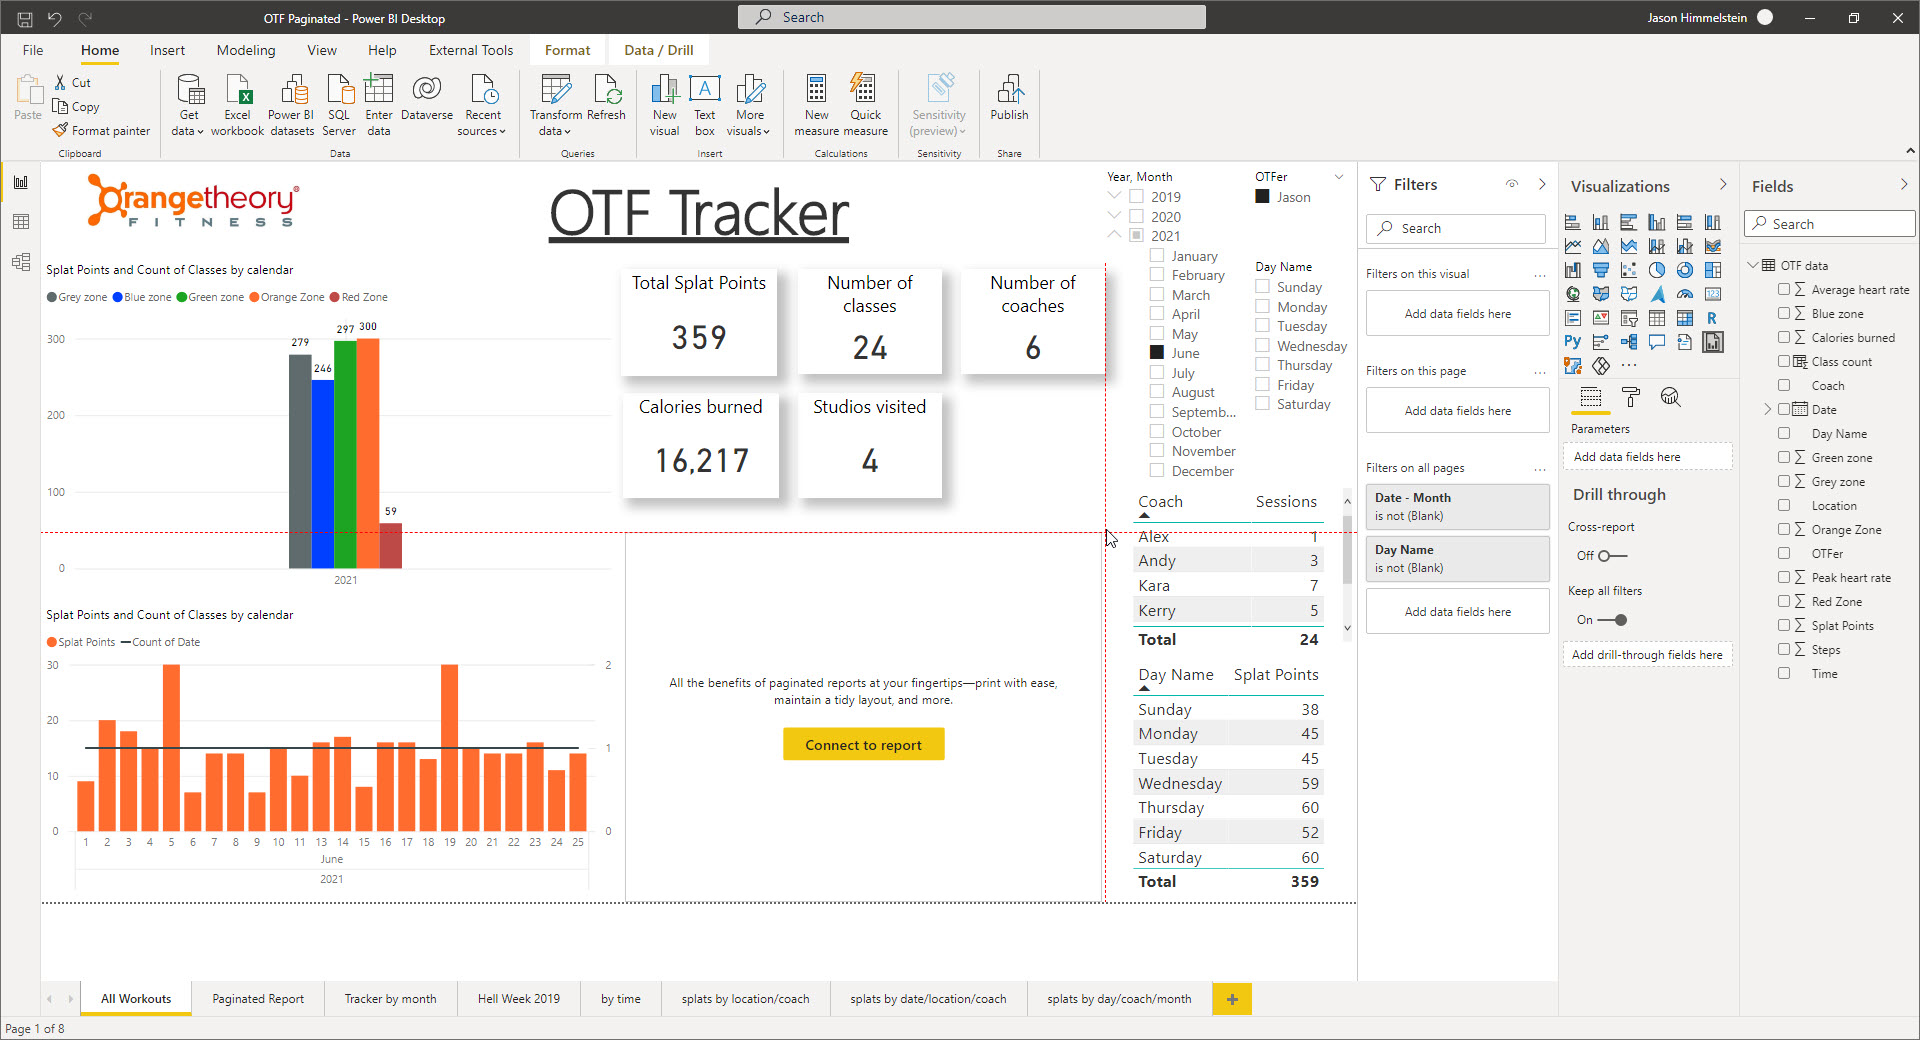
    Configuring the Paginated Report Visual

    Now we can connect to a report. Click the big yellow button and the screen will change to show us the available Paginated Reports that you can choose from.

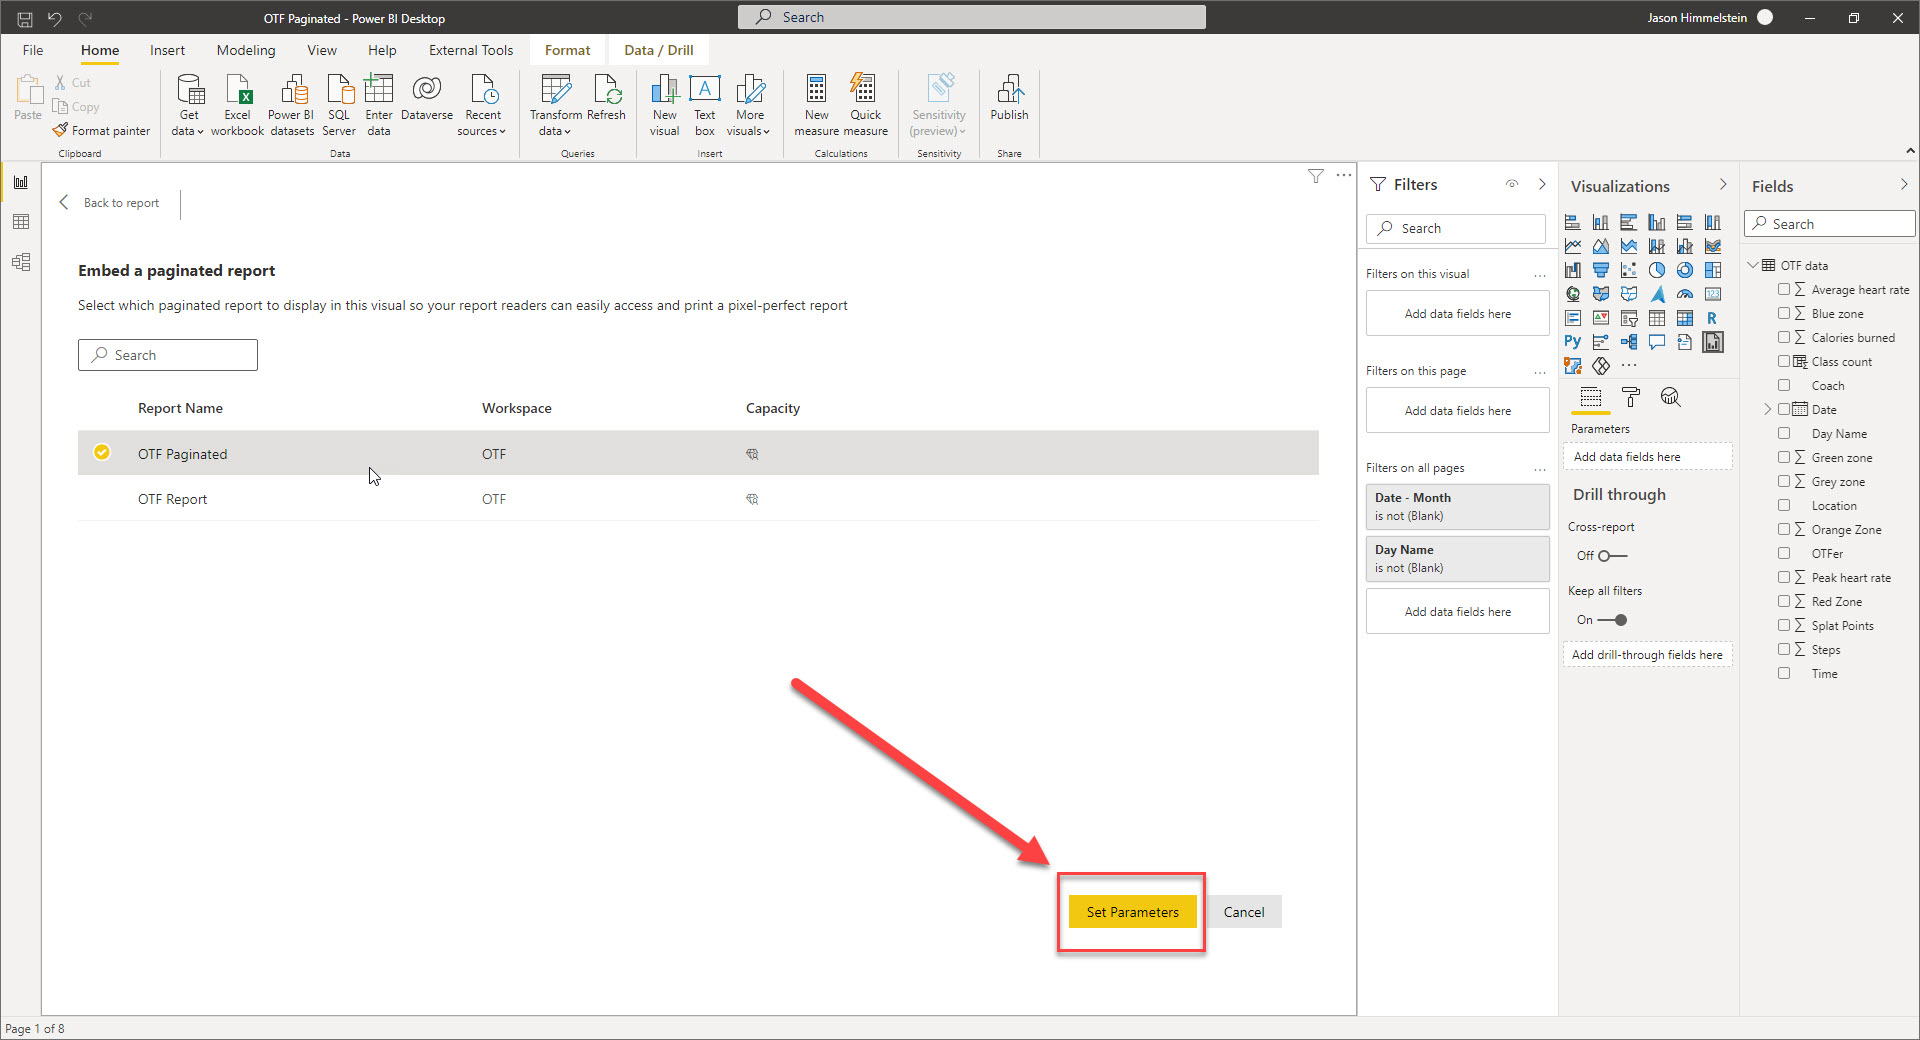
    Once we select the Report, we need to add in Parameters before moving forward. Drag the Date & Day Name Fields into the Parameters field in the Visualization pane.
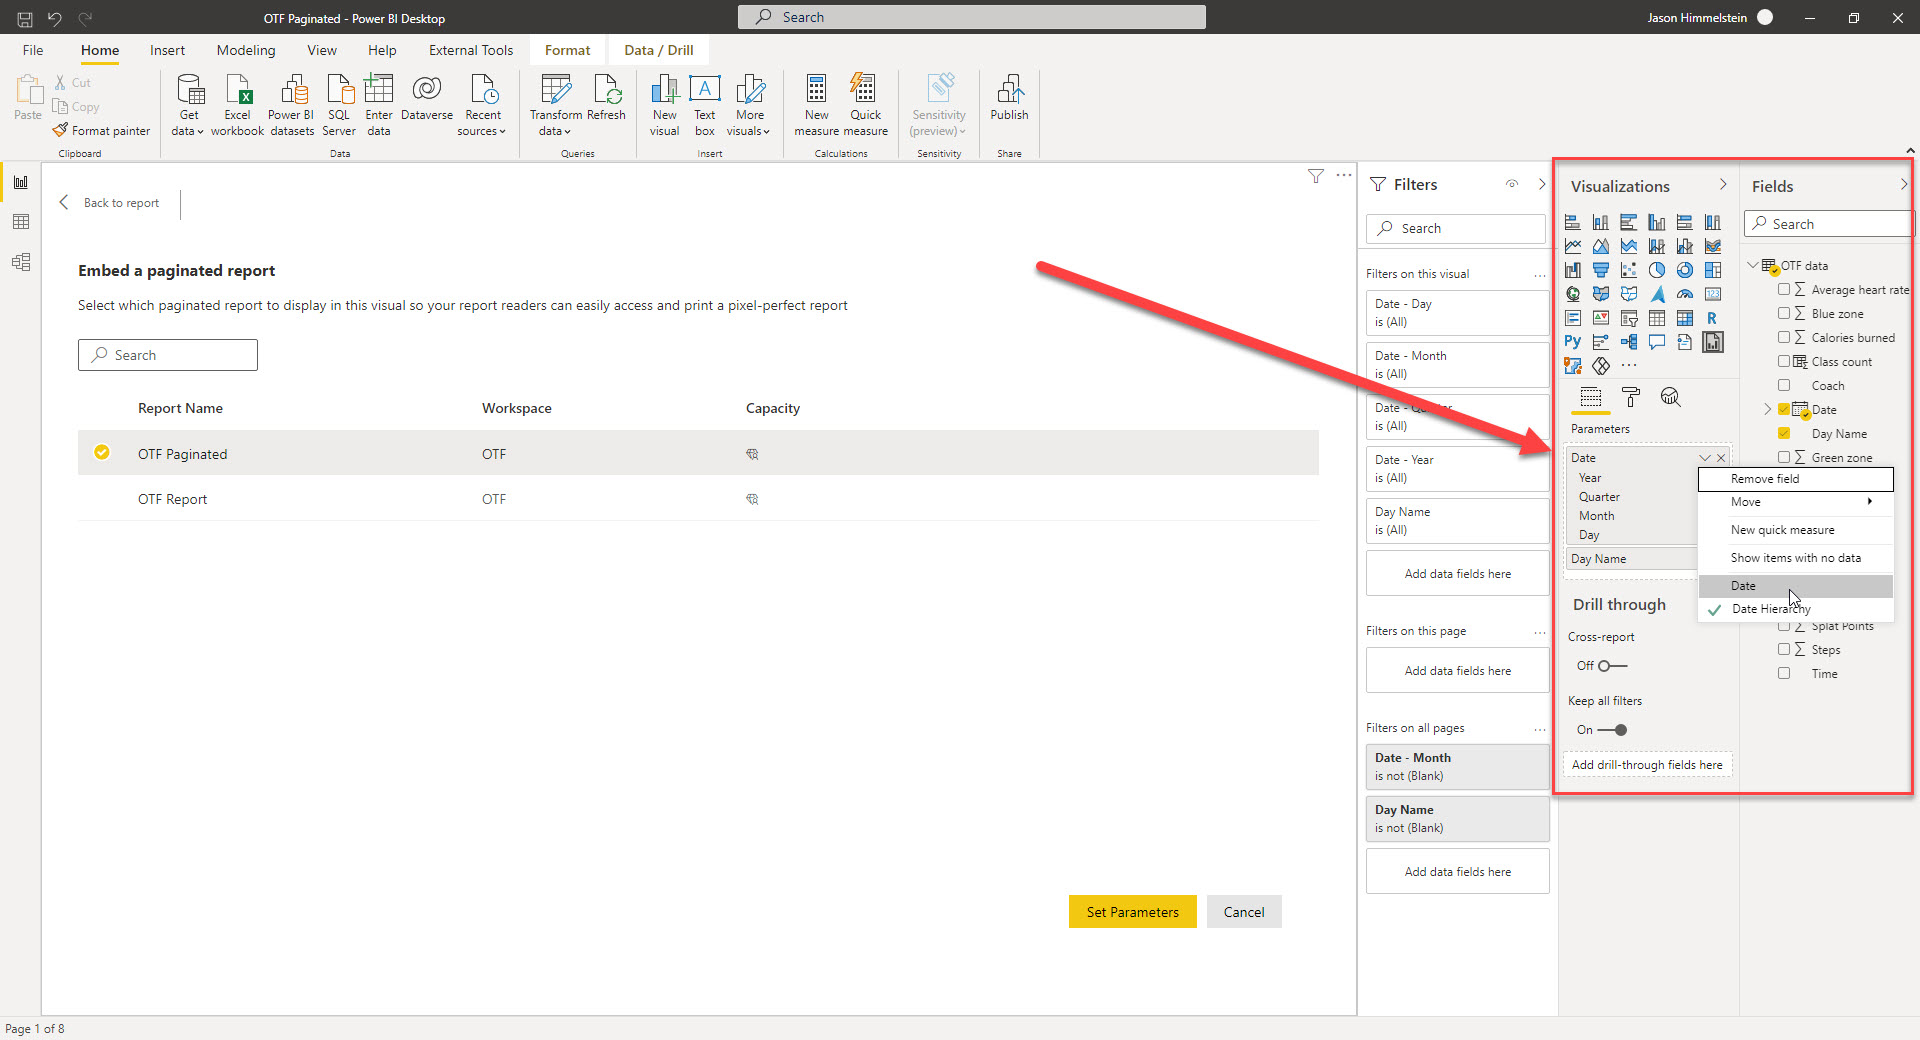
    After we have done that we will want to change the Date from a hierarchy to a single date so that it can be sliced properly.
    Next, we click the “Set Parameters” button and change the parameters from the “use default” option to the specific Power BI fields that we want to use. Once that is done, we click the “See Report” button.
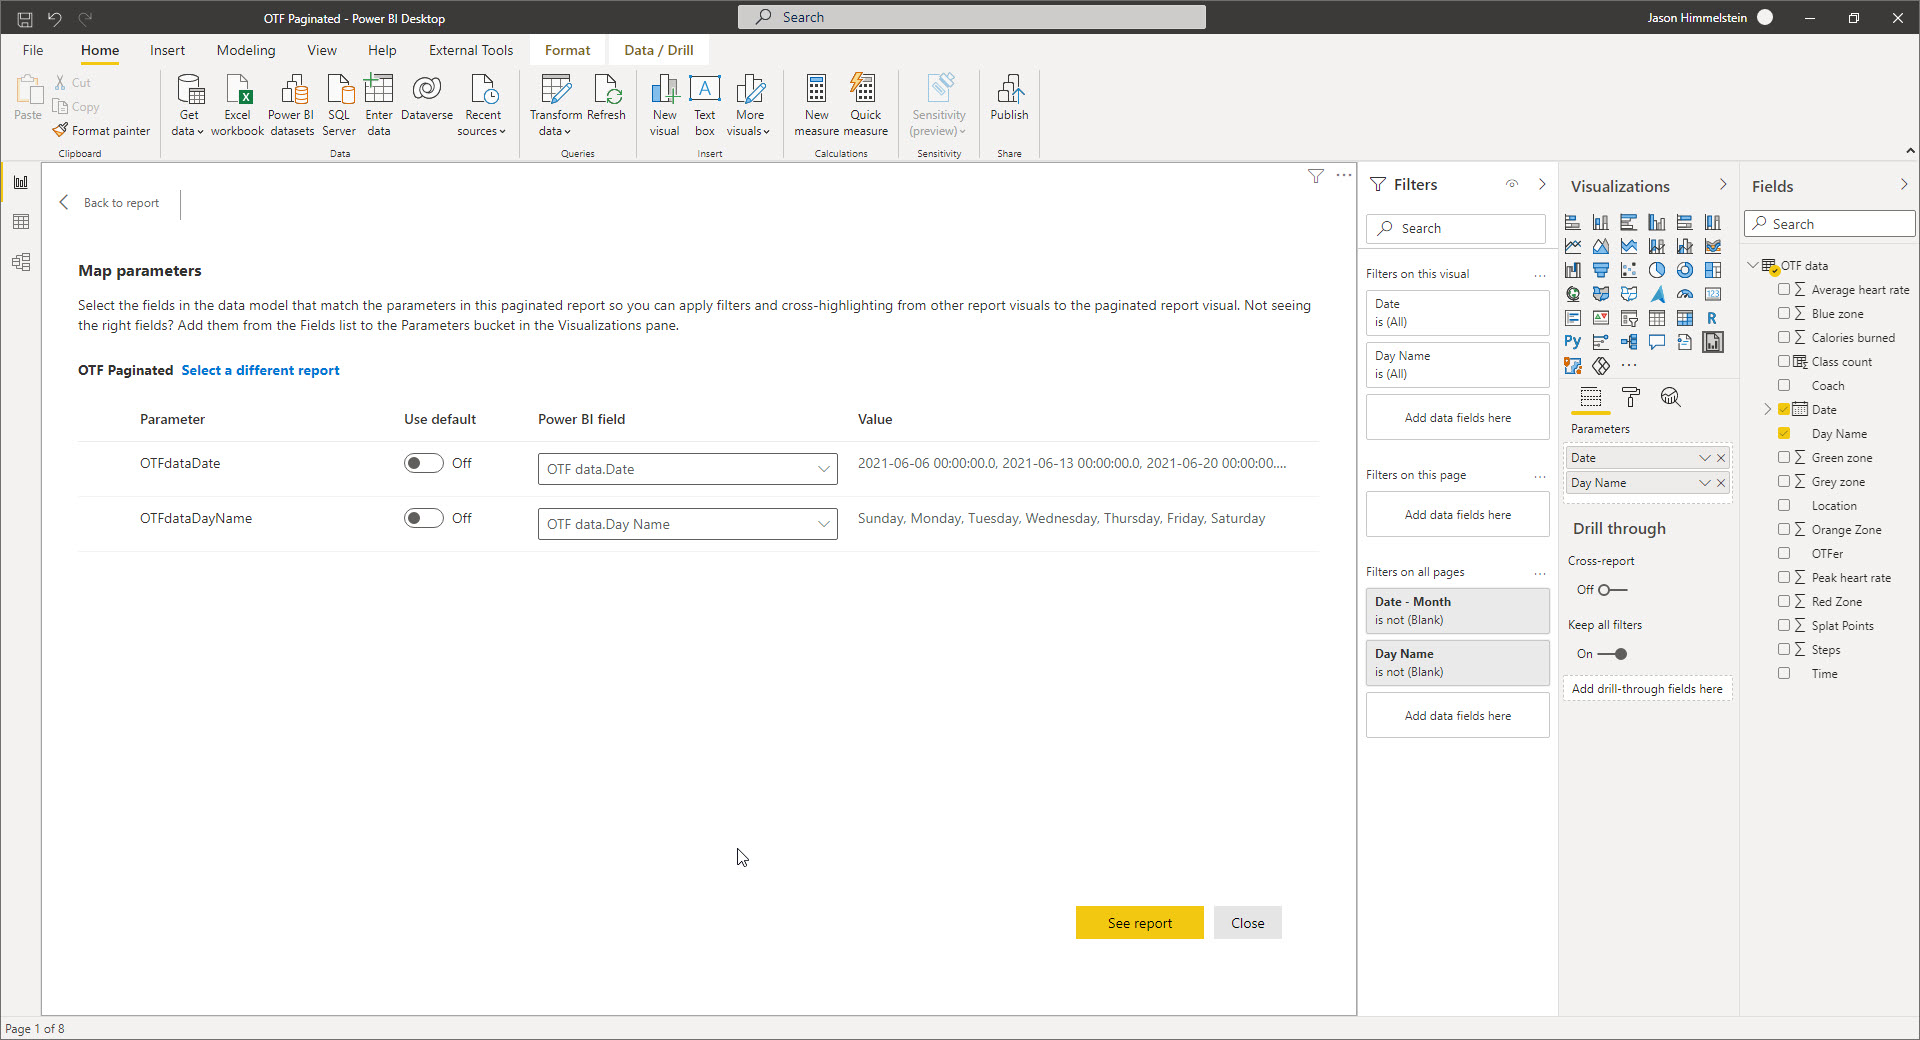
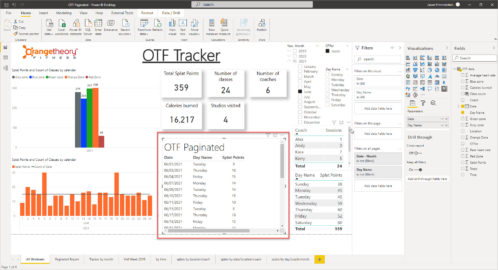
    Once the report renders, we will see the Paginated Report showing up in the visual space we placed it in and filtered to match the rest of the Power BI Report.
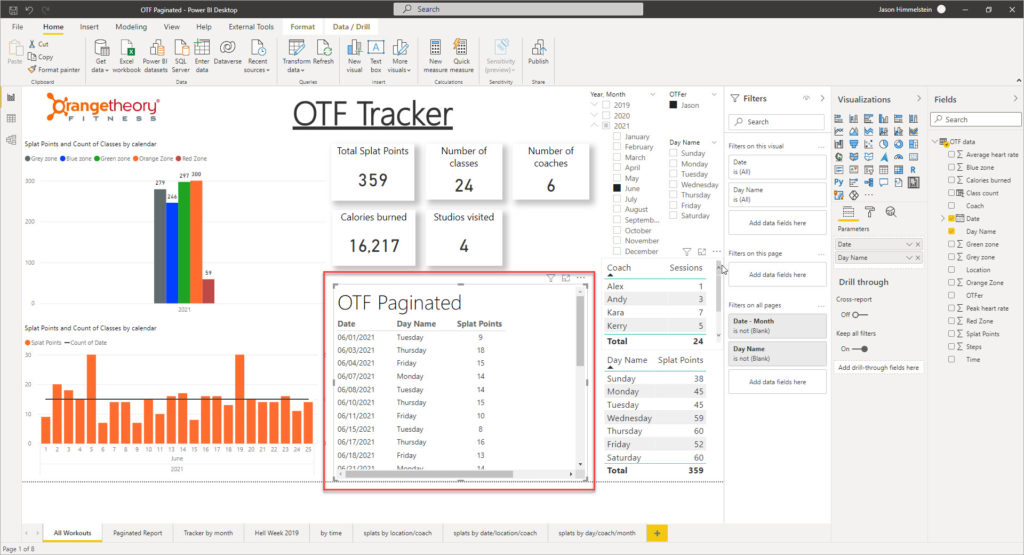
    This image has an empty alt attribute; its file name is 41-1024x555.jpg

    Using the Paginated Report Visual

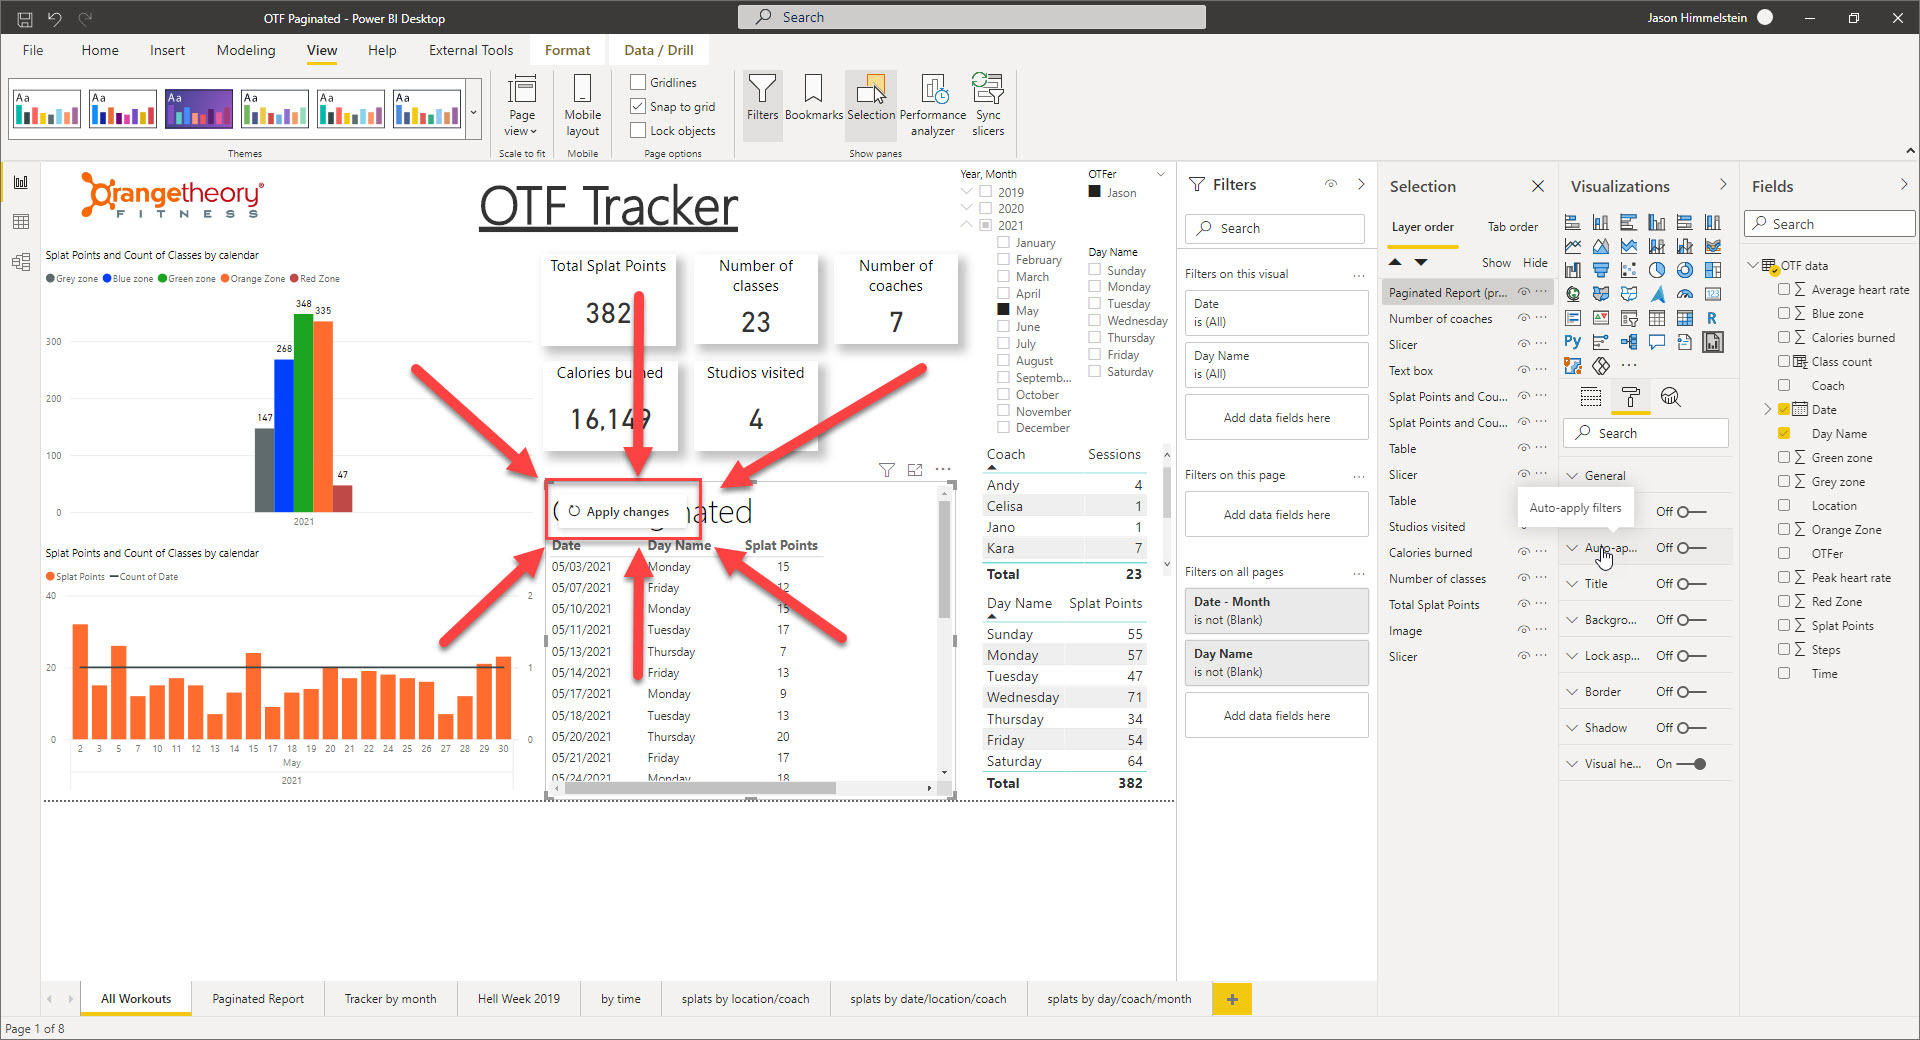
    If we change the month from June to May in the Year,Month slicer we will get a dialog at the top left of the Paginated Report visual that says “Apply Changes” while the rest of the report simply changes. This is the default setting as of the June 2021 release and allows us to not have to wait for the Paginated Report visual to refresh, which takes longer than the other visuals, incase we want to tweak our slicers a few times before seeing the Paginated Results.

    This behavior changed under the Formatting tab of the Visualizations pane when the Paginated Report visual is selected. That can be tricky at times, so I recommend using the Selection pane (found under the View menu in the ribbon) to help us get this visual selected.

    In the formatting options we will find “Auto-apply filters” as a toggle. We will only see “Auto-ap…” as the default layout of the Visualizations pane is small. Once toggled we will see the “Apply changes” box disappear, and it will automatically refresh as we change the slicers.
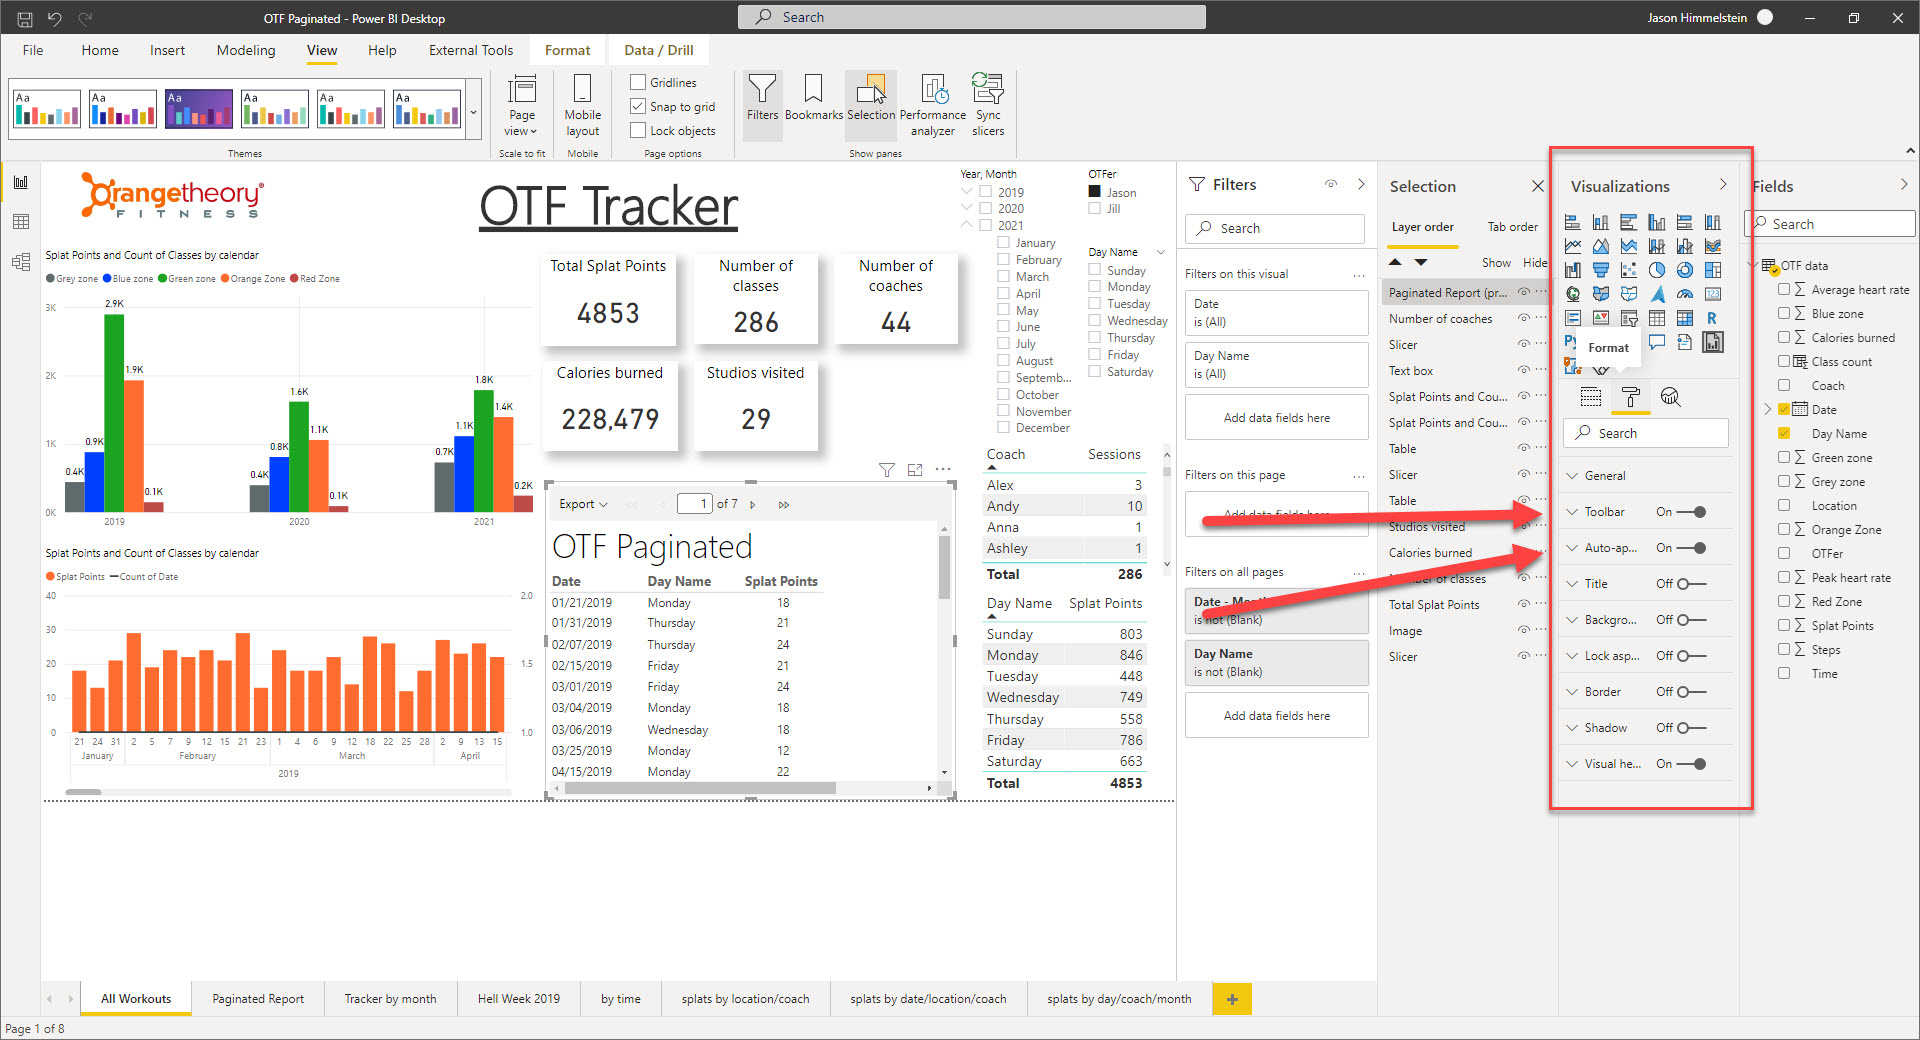
    While we are making updates in the Visualizations pane, I would encourage you to enable the Toolbar in the visual so that you can do things like change pages and Export data to all of the formats Paginated Reports is able to export to.
    Conclusion

    I hope that you find the Paginated Report visual as amazing as I do. It is going to change the way my customers work with their data.

    If you want to find the full white paper please feel free to click here to access it.
  • Get the Power BI Desktop External tools tab to show up

    Get the Power BI Desktop External tools tab to show up

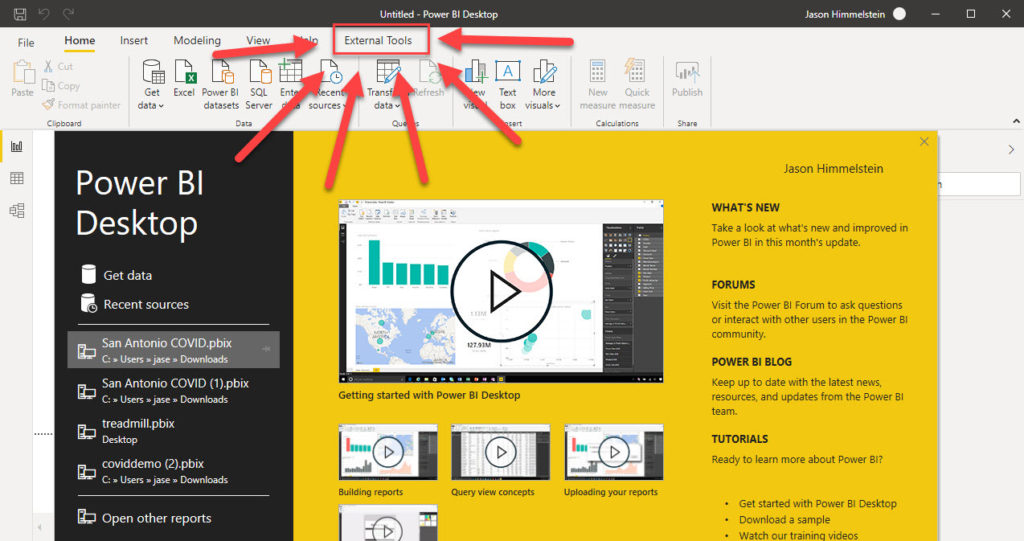
    The July 2020 release of Power BI Desktop brings some awesome new functionality with it: integration of external tools in the ribbon! There have been external tools written by community member and tools vendors for quite a while now, but they have never integrated with the product and shown up inside of the Power BI Desktop experience until now.

    This is exciting stuff because many of these tools are highly useful today and will continue to grow in importance as the product continues to mature. Microsoft does a great job of advancing its products, far better today than 5 years ago when Power BI first showed up on the scene, but they are never going to be able to do everything. That leaves white space for vendors and community members to contribute.

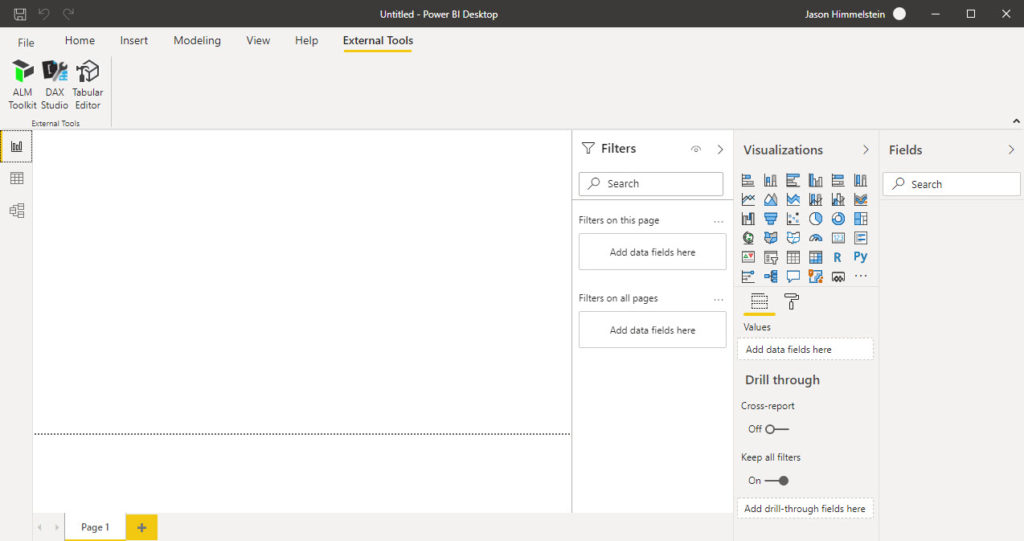
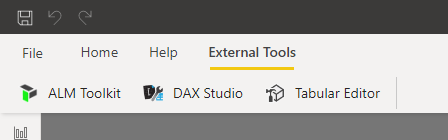
    The first 3 tools that are being made available through the External Tools pane in the ribbon are: ALM Toolkit, DAX Studio, and Tabular Editor. We have been told that Power BI Report Builder will show up in this space eventually as well.

    Here is an excerpt from the blog post on the Power BI blog site explaining a bit more about this:

    The External Tools ribbon contains buttons for external tools installed on the machine and registered with Power BI Desktop. External tools launched from Power BI Desktop are automatically connected to the Analysis Services engine running behind Power BI Desktop providing a seamless experience for users.

    https://powerbi.microsoft.com/en-us/blog/power-bi-desktop-july-2020-feature-summary/#_Launch_external_tools

    As I said, this is great news so why am I bothering to write a post about something that was clearly covered in the Power BI blog and I talked about on the BIFocal.show podcast? The answer is that I updated my work PC to the July 2020 version of Power BI Desktop using the Microsoft Store method and didn’t get the new External Tools ribbon. I was a bit perplexed.

    I checked the Preview features dialog under Options in the Options and settings menu and there was no option for turning it on. I remember that this feature went right to General Availability, so it shouldn’t have shown up there anyway.

    Then it hit me: I didn’t have any of the External Tools installed on my work machine yet. I had them installed on my VM that I use for demos and on my home PC rig, but I haven’t used any of them in my day-to-day for work yet (I’ve only been at EY for 4 months now). These are External Tools meaning they are not a part of the product, so logic says that you have to install them separately to get them to show up and why have a tab if there isn’t anything there to see?

    Once I installed the tools the Tab showed up without an issue, although I had a few hiccups getting them installed. I decided it was probably a good idea to share my experience installing the tools now that a broader group of people are going to be looking at using them.

    Here is my how-to with a few Gotchas along the way. Enjoy!

    The walk-through

    July 2020 Power BI Desktop

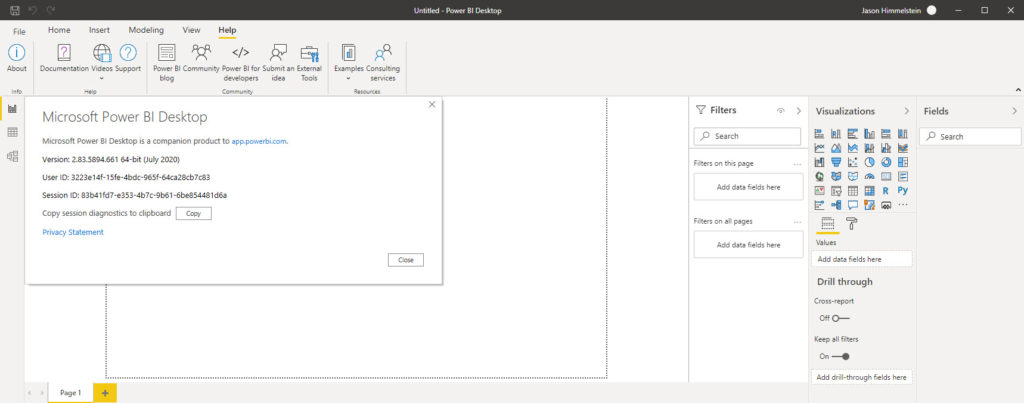
    First validate that you are running the July 2020 version of Power BI Desktop. I highly recommend using the Microsoft Store version if you are able to.

    Your next step is to download the tool or tools that you want to use from the list I gave above.

    SmartScreen tries to protect you from yourself… and malicious code

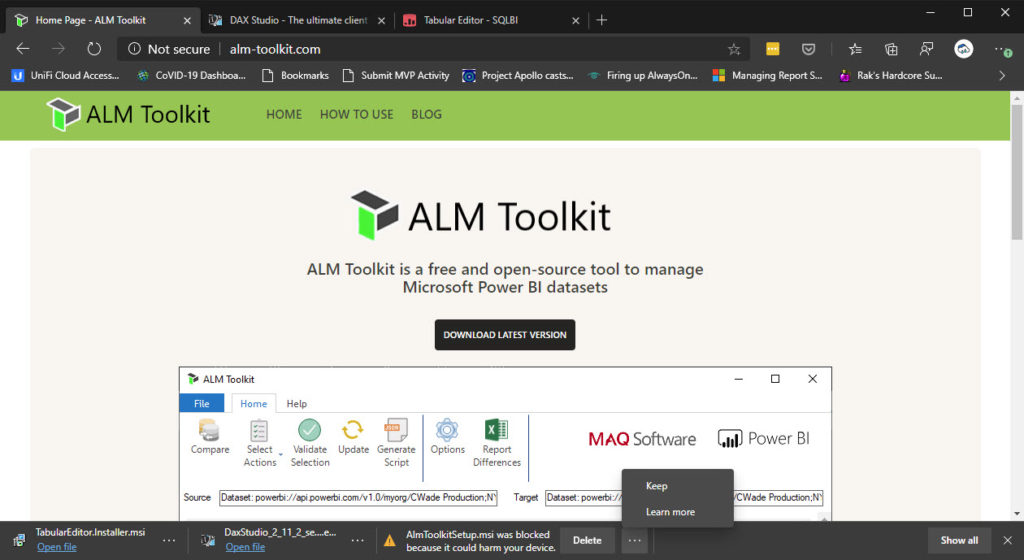
    The first snag that you will likely experience is that the built in Microsoft SmartScreen protection is going to block one or more of the downloads.

    If you chose to go forward, as I did, you need to click on Keep and then go to Downloads.

    Warning! Consult a PC physician if virus symptoms arise. Computers can’t get COVID though…

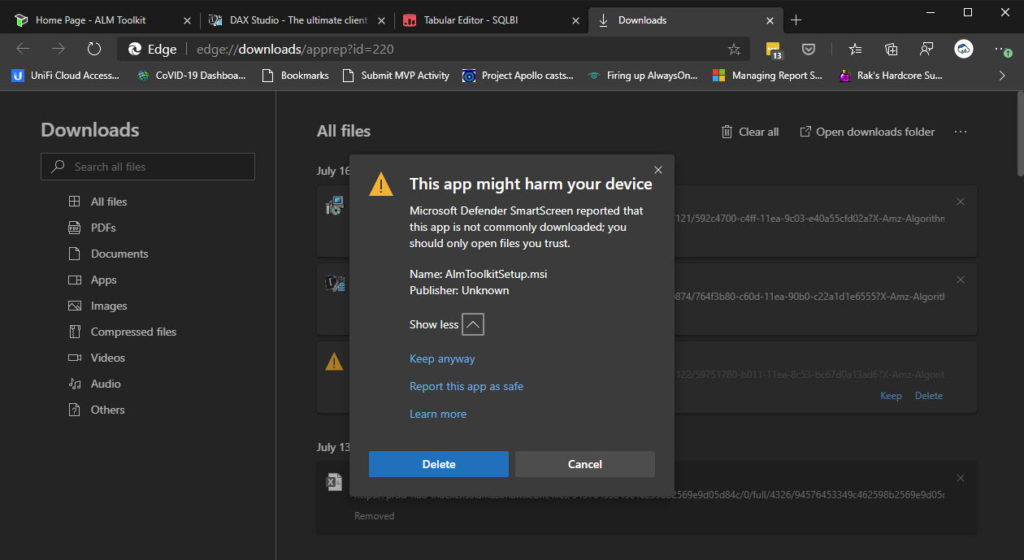
    You will need to expand the Show more option and choose to Keep anyway so that you can execute the msi package.

    CAVEAT: I am not advocating you install random stuff on your computer. I am showing you what I did, as I personally trust the folks who created these packages. Hopefully they will get signed certificates at some point, 
    but today they are unsigned and that is why this happens.

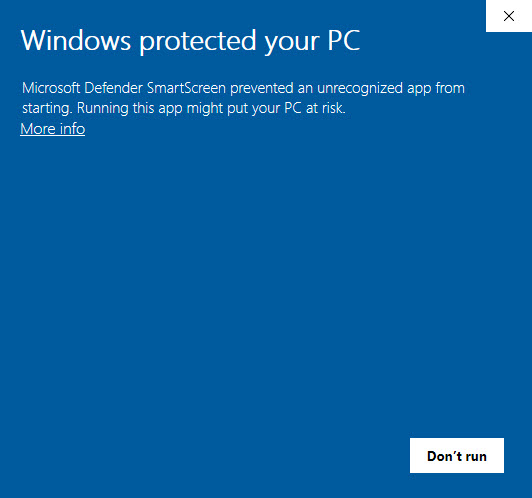
    Finally you are ready to execute the installer and you get this message:

    Insert corny “you lose” sound effect here… whap whap whappppppp….

    Ok… now you start rethinking what you are doing, not just with this installation but your whole life… maybe I should have been a painter or a chef?

    You finally decide that you really do want to install these super useful tools so you go back to the installer msi and right click then choose to Install as Administrator.

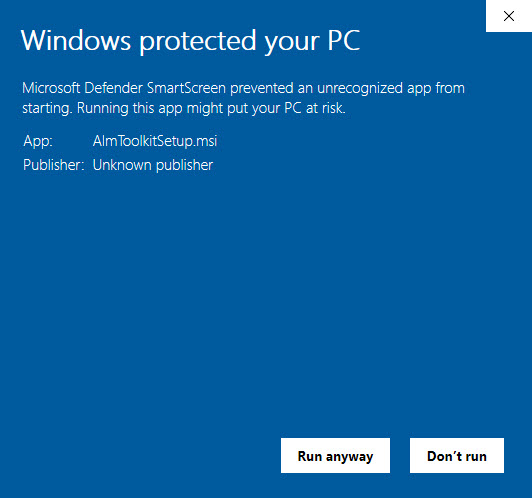
    Then you get this screen:

    I turned around 3 times & spit, splashed holy water, & fed a chicken… do I Run anyway?

    This time you get the option to Run anyway. If you choose to move forward at this point, like I did, you will walk through the normal Install Wizard screens for the software as you would for any other commercial product. Once complete you are ready to go with the tools.

    You will need to restart Power BI Desktop if you happen to still have it open and then…

    Tada!

    You now have the External Tools section of the Ribbon! Congrats.

    If you did everything I listed above you should see this:

    SO PRETTY!

    Your experience may differ from mine, as my own experiences did working across 3 different machines with different levels of access. The scenario I outlined above was in my most restrictive environment and therefore I felt was the most reasonable one to document. There was a step I didn’t document about how I had to elevate permissions differently because of corporate restrictions on my work PC. Every company is going to be different so I left my company specific step out.

    If you have one or some of the External Tools showing up but not all, you may have older versions of the tools installed that need to be updated or you might find that are wondering why don’t have all 3 of the tools showing up you should go watching Adam Saxton‘s Guy in a Cube video explaining that scenario is super useful. If nothing else you should see how he adds in Patrick Leblanc‘s NoSums tool into the Ribbon. That was insane amazing and Patrick is super stoked about it.

    Hope you found this useful. Stay safe & healthy folks!

  • Office 365 Service Description Power BI report

    Office 365 Service Description Power BI report

    I did a thing tonight that I swore I would never do. I used the “Publish to web” feature in Power BI. I had a good reason and I followed the guidelines I always tell people to follow, but I still feel a bit icky about it.

    I was writing a document for a customer this afternoon and once again I ran into a situation where I wished that I could have the old Service Description Excel workbook that Microsoft used to put out. It was a really cool pivot table that allowed you to quickly see what features aligned to which Office 365 & Server based licenses. Unfortunately they stopped publishing it a few years ago. It is a giant pain in the ass to drill through all of the features across all of the SKUs to make sure that you are giving customers the best recommendations when it comes to licensing.

    To be honest what I really missed was the ability to use conditional formatting on the thing and create a REALLY easy to consume version of the document for “at a glance” use. The goal is to be able to look at the features list and see which Microsoft SKUs they are available in.

    This afternoon I ran across a nice table that does just that in the Office 365 Service Description part of Docs.microsoft.com for SharePoint, but the layout makes it relatively unusable. I got excited thinking that this was the answer to my old Excel workbook and immediately attempted to copy & paste into Excel, which failed miserably because of formatting. Then I got mad. I swore a ton. I called and yelled at Mark Rackley because that is one of the things I do when I get mad at SharePoint stuff. I believe that my last words on that call were “going to have to go PBID on their shit to get what I want”. Sorry for the colorful language gentle reader, but I warned you I was mad and swearing…

    I grabbed the Web connector and pulled in the data that I wanted, wrote a bunch of queries, unpivoted some columns, hacked away for about 2 hours and ended up with a passable version of my old favorite tool. Then I went a bit nuts and decided to do the same thing for the Office 365 Platform Service Description which is considerably more complex and lengthy.

    Finally I created a new Power BI Workspace and published it to the web. I still feel icky, but hopefully people will find this useful and that will make up for it. I have embedded the report below or you can visit https://jasehimm.online/servicedescriptions to access it directly.

    In the coming days I plan to add more to this. Let me know if you feel this is useful & what you would like to see added in the comments below or you can tweet at me @jasehimm.

  • 6 more tips & tricks for Microsoft Ignite 2019

    6 more tips & tricks for Microsoft Ignite 2019

    I wrote an article back in 2016 about things to think about for Microsoft Ignite in Atlanta. I decided that it is time to refresh that with some things I have learned over the years and specifically some learnings from the past four Microsoft Ignites, many TechEds & SharePoint Conferences, etc.

    Wear comfortable shoes

    The Orange County Convention Center, affectionately known as the OCCC, is HUGE. You are going walk a ton. In previous years I have averaged around 18k steps per day. Wearing comfortable shoes is CRITICAL. Even though the extended forecast puts the highs in the low 80s (upper 20s in Celsius) with lows in the upper 60s (upper teens in Celsius) personally I will be avoiding sandals and going with well supported tennis shoes all week.

    Plan backup sessions

    There are several reasons for doing this. Let’s get the ugly one out of the way first: you just want to get out of the session you are in. At some point it’s going to happen. You will be sitting there thinking to yourself “I want to get out of here”. Not every presenter is going to hit home for you. Maybe the topic is too deep, to narrow, not deep enough, or you just don’t like the presenter’s style.

    On behalf of all Speaker’s at all conference everywhere: PLEASE GET UP AND GO. If you do it politely & quietly most presenters won’t even notice that you are going. Do not sit there miserable wishing you could leave and wasting your time & money being in a session you are not enjoying. Nobody wants that. You will be unhappy, give the speaker bad session scores, and not get anything out of that time block.

    Instead, make sure that you have backup sessions ready to go so that you can jump out of session and go to another.

    • The session you wanted to get into is full. You registered. You expected there would be a seat for you as a result, but fire code says they cannot let you in or the theater is just overflowing. This is a very real scenario at this event. One of my theater sessions has over 1500 people registered for it. The theaters are on the expo hall floor and do not hold that many people. Last year they had seating for about 100. If you walk up to one of these sessions late it may be time to jump to a backup session.
    • The session you wanted to go to is ¾ of a mile from the last session you just went to. There is no easy way for you to get there without sprinting across the OCCC and the seas of people don’t make that easy.
    • Almost all the sessions are being live streamed & recorded. Putting multiple sessions on your calendar can help you later when you want to go find sessions that you want to watch. You are already reading all the session abstracts; you may as well build your backlog to watch later.

    Engage in the Hub & show floor

    There are 25 rows of vendors. The place is massive. That is before you come to the Community areas. You are going to get lost. Make the most of it. Some of the most fun conversations at vendors booth’s I have had over the years are the ones that I just stumbled on because I was lost or just wandering.

    Make sure that you spend plenty of time in the Microsoft zones peppering the Product Teams with questions. That’s why they are there. You aren’t bothering them (most of the time). Booth duty at these events I can tell you that it is BORING when no one is there to talk to. You are on a shift with folks that you may know and like, but after the first hour you know how their kids, dog, wife, cat, bird, in-laws, tomato plant, and PTA President are and you want attendees to talk to.  They want to talk to you. Bring your questions.

    Be sure to find Community Central, the Global Diversity & Inclusion zone, Experts Connect, the Microsoft Store, and the Hub Hangout. This is where you will find people like you who are dying to talk about that geeky thing you just learned about and need to discuss.

    Hydrate

    This seems intuitive, but every year I run into people who are dehydrated because they are used to a different pace of life than the conference world. They forget that they are in Florida where it is going to be hot, even though it is supposedly almost winter in this hemisphere. Also, it is going to rain every day around 5p. Bring a small umbrella or expect that you are going to get wet. Don’t worry, it will be warm enough that you will dry out relatively quickly.

    Be out-of-office (OOO)

    We all put up our “Automatic Reply” or OOO message, but how often do we actually follow through on the “I won’t be looking at email during this period of time” statement? Email is accessible everywhere nowadays, so it is hard to ignore. There are some things that you can do to help yourself avoid this black hole that will pull you away from being present at the event. Here is what I am doing:

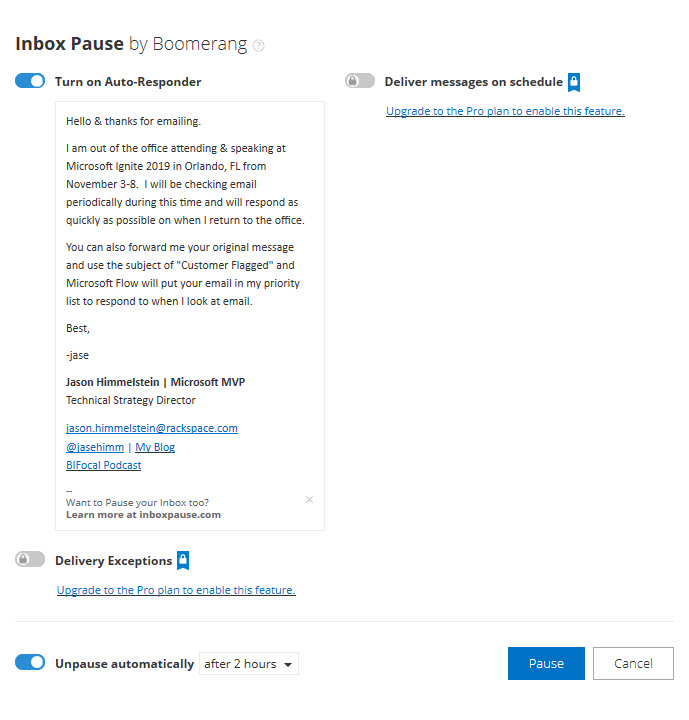
    Boomerang

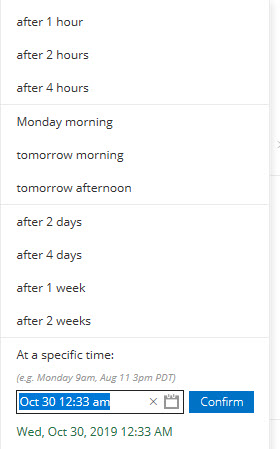
    This is an awesome add-in for Outlook & Outlook on the Web that allows you to pause email delivery into your inbox while turning on an Auto-Responder so that people know that you aren’t seeing their email. This is REALLY handy for when you want to be in the moment without the constant distractions.

    The Pro version, if you are lucky enough to be licensed for it, has many other awesome features but sticking with the pause feature on email delivery it allows you to get emails delivered on a schedule, meaning you could get email at 6a, noon, and 6p so that you are able to disposition your email when it is most convenient for you.

    Microsoft Flow

    I use this anytime I have Automatic Replies turned on. I believe that the OOO message is a social contract that people should respect. If what they are emailing about is truly important enough to get a response while you are OOO or something that they want to make sure sits at the top of the pile for when you return, they should be willing to take 1 extra step.

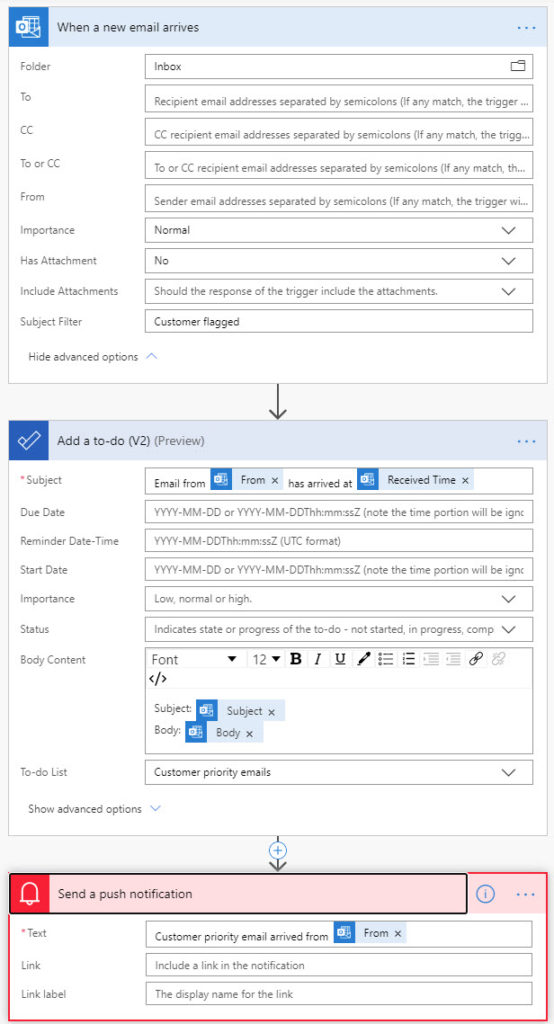
    I put the following in my OOO messages: “You can also forward me your original message and use the subject of “Customer Flagged” and Microsoft Flow will put your email in my priority list to respond to when I look at my email.”


    Here is what the Flow looks like:

    I submitted this as a template to the Flow Gallery, but I don’t know if or when they will publish it. Check for “Out-of-office message enhancement”.

    USB battery pack

    This is CRITICAL. Even if you are on the newest, brand new phone that has amazing battery power the OCCC is going to suck the life right out of it. The building is made of concrete and reception is generally mediocre, however your phone is trying desperately to please you by delivering as many bars as it can. This results in rapid battery drain. I have never made it a full day at the OCCC, or most other conference centers like it, without needing a charge up. Wall plugs are at a premium, mostly because people didn’t take the last piece of advice and are sitting on their laptops trying to work instead of engaging. Being portable is key. You still have time to pick up one of these wonderful devices. Here is a link to some options: https://smile.amazon.com/s?k=usb+battery+pack. I am personally partial to the Anker & RAVPower brands as they have served me well in the past.

    FYI, I don’t profit from the things I have recommended above. Even the Amazon link is just to the generic AmazonSmile search page. If you don’t know about AmazonSmile please go check it out. It is a way that you can help a charity just by doing the shopping you normally do. There is no impact to you.

    Conclusion

    This was way more longwinded than I was planning, but hopefully it helps you. There are many posts out there like this that will tell you about parties galore and how to have fun at the event. Go read all of them and drain every ounce of good from the event that you can. It is a crazy, fun, exhausting, massive event.

    If you are interested in seeing me at Ignite please check out my profile on the Ignite Speaker Directory at https://myignite.techcommunity.microsoft.com/speaker/564517.

    Feel free to stop by the Rackspace booth #1631 where the “Rack Gives Back” committee is contributing $1 to the American Heart Association, up to $3000 for the week, for everyone scanned at the Rackspace booth. When you get scanned you will get a badge ribbon like this:

    I will be hanging around the booth some, but if you don’t see me there just the Rackers at the booth as they will know how to track me down.

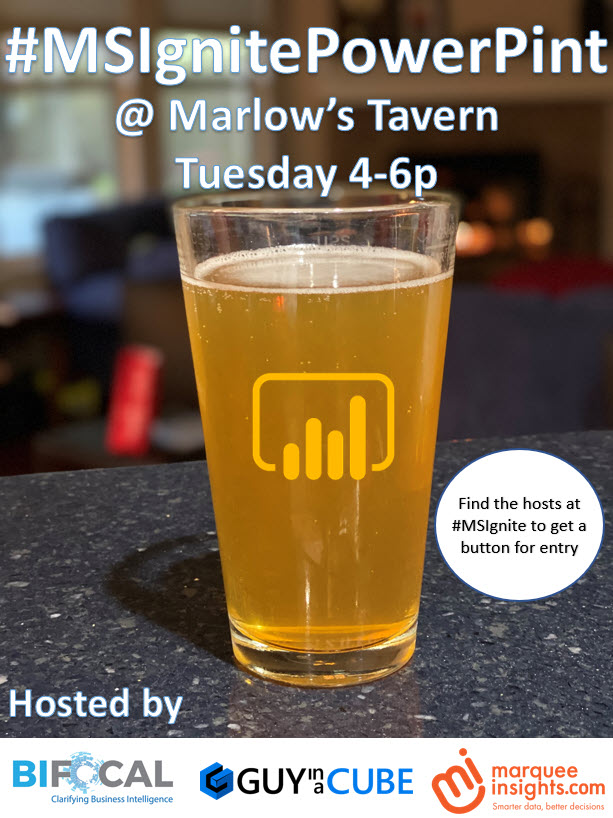
    One last thing that we just announced tonight: John White & I are hosting a #MSIgnitePowerPint along with Treb Gatte from Marquee Insights & Adam Saxton from Guy in a Cube at Marlow’s Tavern on Tuesday from 4-6p. In order to attend you need to grab a pin from one of us, so find me at the event!

  • What you should know about SharePoint Conference North America

    What you should know about SharePoint Conference North America

    SharePoint Conference North America (SPCNA) is poised to be the place to be to learn what’s new, next & top of mind from Microsoft. This event will contain the most sessions delivered by Microsoft about Office 365, SharePoint & OneDrive during 2018 and split across 3 main tracks of Developer, ITPro, & Business User.

    There are 2 sides to this event that are worthy of note:

    1.) Microsoft delivered content
    2.) Community delivered content

    The Microsoft content is being delivered by the Product teams and will focus on the latest, greatest, bleeding edge features & functionality that they are releasing AND what is still to come. Many of the sessions are roadmap sessions that lay the future foundation for what you can expect to see Microsoft deliver over the next 18 months. Add to that the SPCNA keynote will be headlined by Jeff Teper to start the show and you can be assured of some surprises & fireworks like the SPCs of old.

    The Community delivered content, put together by track chairs like me, are focused on what we know you want to learn about how to keep up with the new wave of Office 365 features. Many of the top speakers in the space have been tapped to deliver brand new sessions at SPCNA. The session catalog has been ever evolving as Microsoft slowly drops clues to what they are going to be sharing with us in May.

    This will be the first time since 2014 that the SharePoint Community (with the addition of the broader Collab communities of OneDrive & Yammer) is coming together in Vegas the way that we used to for the SharePoint Conference. The message we have heard out of the Microsoft is that they are “All IN” & are “doing this because the people have been demanding that they go back to Vegas to deliver their latest update in person, because the magic is in the Community”.

    On a personal note I am lucky to participate in the major conferences in the US, plus some in other parts of the world, and for me this is a cannot miss event. With that said, you can bet your last chip that I will be at SharePoint Fest & SPTechCon this year as well to take part in those unique conferences & engage with the community as I always have. This one event does not define our community, but we hope that as SPC always did in the past, it can provide an additional spark that lights the fire of excitement for the year to come and all the other events that help to strengthen our amazing community.

    See you in Las Vegas where I will be delivering a Power BI pre-con with my BIFocal.show co-host John White & a hybrid SharePoint & Office 365 post-con with Neil Hodgkinson, Bill Baer, & Spencer Harbar!

  • The Future of SharePoint is almost here!

    The Future of SharePoint is almost here!


    FoSEvent banner

    Good morning from 34k feet somewhere over New Mexico! I am currently flying out to San Francisco to take part in the Future of SharePoint event tomorrow. I have been lucky enough to have spent time out in Redmond over the past few weeks and have had a chance to see some of what Jeff Teper and the SharePoint Team are going to share with us tomorrow and I can tell you that it is some game changing, super exciting stuff

    If you haven’t already registered for the Live Stream you should stop reading and do it right now…  I will wait… http://aka.ms/FutureOfSharePoint

    Now that you’ve done that we can continue Smile

    If you aren’t able to stream the feed for some reason or just want to an up to the second view into what I am thinking about the event, my colleagues Todd Klindt, Randy Drisgill, and John Ross will also be Live Blogging the event on the Rackspace SharePoint site at http://sharepoint.rackspace.com/live-event. You can download a calendar reminder for this here.

    Want to keep up with what is trending on Twitter around the event? Check out the Twitter Analytics Power BI dashboard that Dave Feldman, John White & I put together below.

    Last night as we were playing with our Twitter Analytics I saw someone tweet the question: “Can the future of SharePoint really live up to all the hype?”. I am hopeful & optimistic for the first time in quite a while that it can, however only time will tell. I for one am betting heavily that it will as I have chosen to tie my career to SharePoint & Office 365. From everything that I have seen from Microsoft recently they are doing 3 things very right in my opinion:

    1.) They are listening. Whether it is via User Voice, direct interactions with them, or the telemetry that they are using coming from the service they are listening to what we are telling them with our words and our actions.

    2.) They are getting fresh blood into the right seats on the bus and keeping the world moving forward.

    3.) They are investing in innovation. This is something that they had stopped for a while, but they are back with a vengeance.  There is nothing more exciting in the tech world to me than innovation.

    I am excited to see what they have to say tomorrow and I hope you are too. May the 4th be with you!
    -jase

  • Microsoft Flow and Power BI make awesome bedfellows

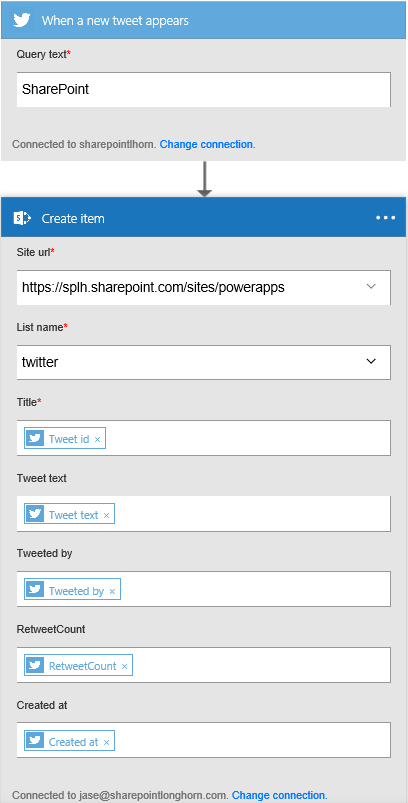
    On Friday April 29th Microsoft release the preview of its latest toy, Microsoft Flow. Flow is similar to Zapier & IFTTT in that it connects to online services and takes actions based upon trigger events. During the demo to a group of Microsoft MVPs we saw some interesting ways to utilize Flows, but I couldn’t wait to get my hands into it to build some fun Power BI visualizations against more easily accessible data. Saturday morning I built out a simple Flow that took data from Twitter and added it to a SharePoint Online list.

    From this I was able to create a Power BI report that visualized Tweets by count of Tweet and demonstrated individual tweets vs re-tweets. The data was drillable to the text level. I gave John White a call because I thought I had finally created something that we could geek out on before he got to it! Amazingly enough I had and within minutes we were adding refinements and enhancements, giddy as school girls.

    The core issue that I was facing with my Report and methodology was that SharePoint lists are not best suited for contain the amount of data that we are likely to see this week with the Future of SharePoint event on Wednesday, let alone a month or year’s worth of twitter data. After we talked my Report had become a very slick visualization (embedded below).

    John & I agreed that we needed more geek out time and decided to meet back up later in the evening. I started getting texts an hour before our meet up time with links to what John had built in the previous hour. An Azure SQL Database to house the twitter information, 5 new flows to capture specific Twitter data, and a Dashboard backed report that is slicker than Canadian Goose poo.

    We knew that we had to share this new cool stuff with the community, but didn’t think we had the cycles to write the hundreds of pages of content we needed to get the point across. Then we remembered that we have Camtasia licenses thanks to TechSmith‘s generous Microsoft MVP offer.

    John & I spent the next hour recording a 3 part series that you can find on the BIFocal YouTube Channel or simply click on the links below. We take you through creating an Azure SQL Database, building Flows, and finally using Power BI to create awesome Reports and Dashboards.

    Our final product in the web series can be found below. Keep in mind that it the anonymous report is only refreshed 8 times a day.

    We hope that you enjoy the content!

    -jase

  • Announcing the new ITUnity web show: BIFocal

    Announcing the new ITUnity web show: BIFocal

    BIFocal LogoI was sitting in the speaker room at SharePoint Fest Seattle having a Skype chat with John White. We were collaborating on some Business Intelligence content that we could deliver at conferences either together or independently, but still ensure that we were providing a consistent message. At some point during this chat one of us suggested that this amusing & informational back and forth that we were having would make for a pretty decent podcast. Dan Holme, CEO of ITUnity, overheard the comment and said “It would make an even better web show on ITUnity!” Thus an idea was born.

    I am excited to announce that a mere 5 months later we are ready to go live with our new monthly web show, BI Focal. We are going to keep you up to date on all of the latest news in the BI space, provide Tips & Tricks, have interesting guests, take viewer questions, and even do some cool demos.

    We hope that you will join us for our inaugural show “Select * from Hosts” on January 28th, 2016 at 1:30PM Eastern Time on ITUnity. Check out our promo below:

  • Announcing the new PowerBI

    Over the course the past few years, Microsoft has slowly been upping its game with regard to business intelligence. In February 2014 Microsoft announced PowerBI for Office 365 and has slowly but surely been improving the offering over the course the passing year. With yesterday’s announcements Microsoft firmly planted its flag in the business intelligence space.

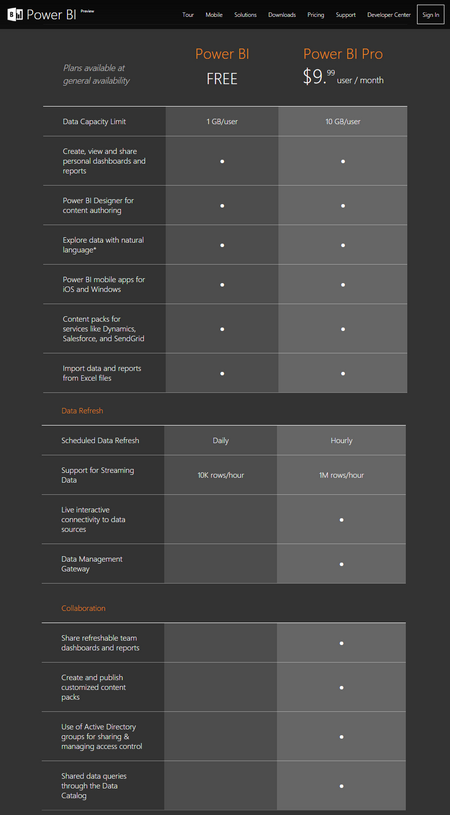
    Previously the offering was an add-on to Office 365 E3 License ($20 per user per month) that cost an additional $20 per user per license. The new PowerBI has been stated to be a 75% percent reduction in price which suggests that PowerBI licensing will be stand-alone from Office 365.

    In addition to the dramatic change of decoupling PowerBI from Office 365, Microsoft has also rolled out to flow will also be rolling out two flavors of the service called PowerBI & PowerBI Pro. The base version will be free general availability while the Pro version will cost $10 per month.

    1

    The major differences between the two offerings is in exist in the premium features such as live interactive connectivity to data sources, ability to leverage the data management gateway, and the collaboration features. Both plans have data capacity limits, quantity of streaming data, and frequency of scheduled data refresh however there different tiers of access to those features.

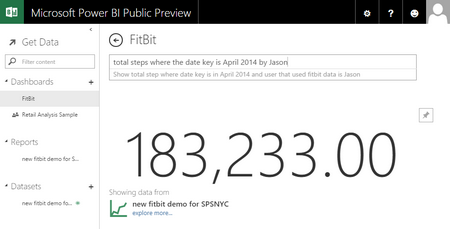
    There are lots of exciting new features that come to the new PowerBI is a part of this new release such as mobile apps for both iOS and Windows content pack services for dynamic, sales force, and send grid as well as the ability to explore data with natural language queries.

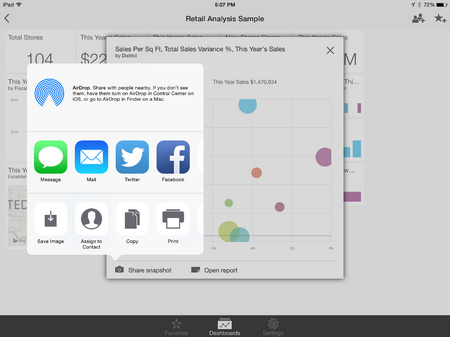
    Having played with the iOS app for iPad over the past several months I can say that the improvements to the mobile experience is dramatic. The new graphs and charts the Microsoft has been working on bring the data to life and give you a true dashboard like experience. One of the awesome features of the mobile app is the ability to share snapshot right from the app.

    2

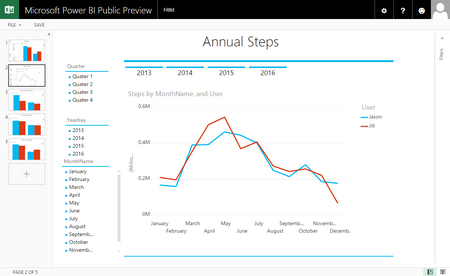
    Uploading an existing workbook with Power Views makes them rapidly available and even indexes them to be available in Power Q&A, referred to as Dashboards, in a matter of minutes. Prebuilt Power Views pop in under Reports and are easily viewed right on the web and in the mobile app.

    3

    4

    More to come on the creating PowerBI models using the new PowerBI Designer, which as of this post is currently working however the upload function is disabled, and connecting to data sources Analysis Services using the new PowerBI Analysis Services Connector.